
 现货黄金周四收盘大涨15.68美元,涨幅0.59%,报2672.23美元/盎司。金价周四盘中一度飙升至2685.58美元/盎司,创下历史新高。
#GoldTechnical Analysis#24K99 News: During the Asian session on Friday (September 27th), spot gold remained stable, with the current price trading near $2670 per ounce. On this trading day, gold traders will focus on the USA PCE inflation data, which may cause significant price volatility. FXStreet's Chief Analyst Valeria Bednarik contributed an article analyzing the technical outlook for gold.
Bednarik wrote that gold is holding above $2670 per ounce; the price is expected to continue its upward trend, although the risk of downward correction has increased.
On Thursday, driven by the weakening of the US dollar and geopolitical tensions, gold prices surged significantly.
 Spot gold closed sharply higher on Thursday, up $15.68 or 0.59% at $2672.23 per ounce. The price of gold soared to $2685.58 per ounce at one point on Thursday, hitting a new all-time high.
At 20:30 on Friday Beijing Time, the USA August Personal Consumption Expenditures (PCE) Price Index will be released.
According to authoritative media surveys, the USA August PCE Price Index is expected to increase by 0.1% on a monthly basis, while the core PCE Price Index is expected to rise by 0.2% on a monthly basis.
The survey also shows that the USA's PCE price index in August is expected to increase by 2.3% year-on-year, while the core PCE price index is expected to climb by 2.7% year-on-year.
The core PCE price index is the Federal Reserve's preferred inflation indicator, the most important economic data of the week, which may provide more clues about the extent of the rate cut in November.
The Fed last week lowered the benchmark policy rate by 50 basis points to 4.75%-5.00%. Traders estimate a 51% possibility of a 50 basis point rate cut in November.
Analysts say that if the USA's core PCE inflation indicator outperforms expectations, this may pour cold water on the significant rate cut bet by the Fed in November, thereby impacting the price of gold; on the other hand, if the PCE data falls below expectations, it may lead people to believe that the Fed will be more dovish, potentially creating upward potential for gold.
FXStreet analyst Eren Sengezer stated that compared to earlier this year, investors have reduced concerns about inflation. Nevertheless, if the core PCE price index increases by 0.3% or higher on a month-over-month basis, it could boost the US dollar. On the other hand, weak data could immediately put pressure on the US dollar.
Short-term technical outlook for gold
Bednarik stated that the gold daily chart shows that the lows and highs of the gold price continue to rise, supporting the appearance of another upward trend for the gold price. At the same time,technical indicatorsFirmly moving upwards within the overbought level, without showing signs of exhaustion in the upward trend. The gold price continues to stay above the firmly bullish moving average line; these lines are significantly below the current gold price level. Overall, despite the lack of technical signs, the risk of a downward correction has increased.
Bednarik added that in the short term, based on the 4-hour chart, it is clear that the bulls still dominate the situation. Gold fell during Thursday's session towards the bullish 20-periodSimple Moving Average(SMA) near 2650 US dollars per ounce encountered buyers, with this moving average currently providing dynamic support. Meanwhile, the 100-period SMA and 200-period SMA are accelerating upwards, significantly below the aforementioned shorter-term moving averages, reflecting sustained upward momentum. Lastly, the momentum indicator is slightly rising in the positive zone, whileRelative Strength Index(RSI) has moderately retreated from extremely overbought readings, showing a slight divergence. This divergence seems insufficient to support a drop in gold prices, but it is the first warning of a possible decline in gold in the next few trading sessions.
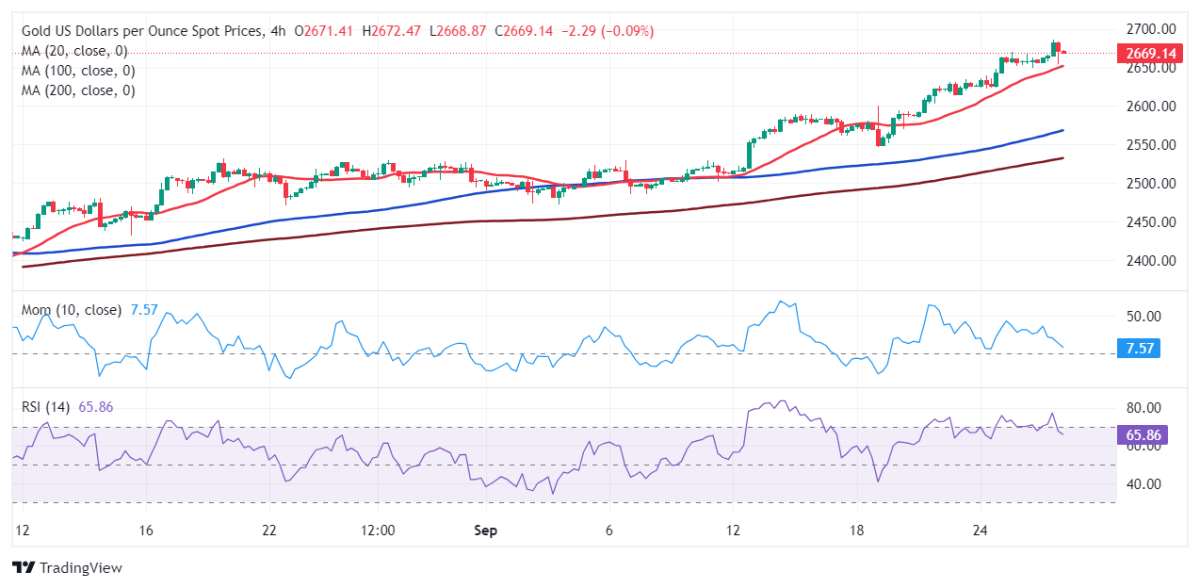
(Spot gold 4-hour chart source: FXStreet)
Bednarik gave the latest important support and resistance levels for the gold price:
Support levels: $2662.80 per ounce; $2650.00 per ounce; $2638.10 per ounce.
Resistance levels: $2685.00 per ounce; $2700.00 per ounce; $2715.00 per ounce.
At 11:08 Beijing time, spot gold is trading at $2670.02 per ounce.