
The most you can lose on any stock (assuming you don't use leverage) is 100% of your money. But on the bright side, you can make far more than 100% on a really good stock. For instance, the price of RB Global, Inc. (NYSE:RBA) stock is up an impressive 110% over the last five years. The last week saw the share price soften some 2.1%.
Let's take a look at the underlying fundamentals over the longer term, and see if they've been consistent with shareholders returns.
To quote Buffett, 'Ships will sail around the world but the Flat Earth Society will flourish. There will continue to be wide discrepancies between price and value in the marketplace...' One flawed but reasonable way to assess how sentiment around a company has changed is to compare the earnings per share (EPS) with the share price.
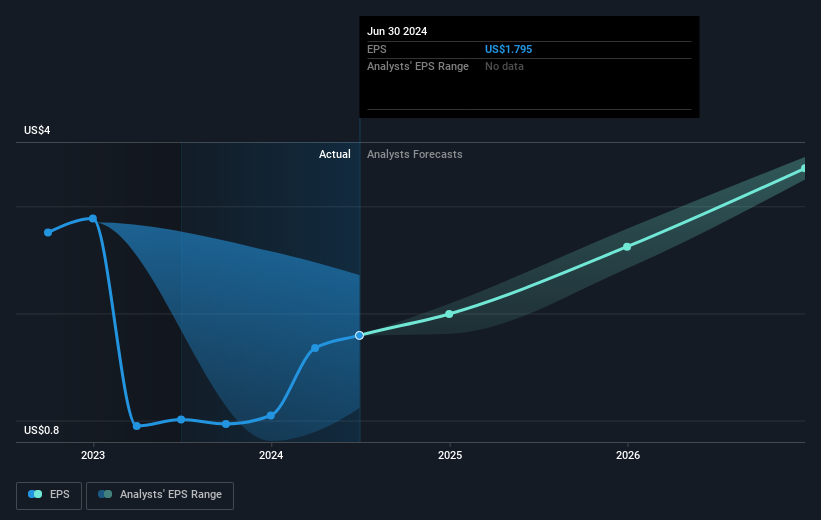
 During five years of share price growth, RB Global achieved compound earnings per share (EPS) growth of 8.2% per year. This EPS growth is slower than the share price growth of 16% per year, over the same period. So it's fair to assume the market has a higher opinion of the business than it did five years ago. And that's hardly shocking given the track record of growth. This favorable sentiment is reflected in its (fairly optimistic) P/E ratio of 46.06.
You can see how EPS has changed over time in the image below (click on the chart to see the exact values).
We like that insiders have been buying shares in the last twelve months. Even so, future earnings will be far more important to whether current shareholders make money. Dive deeper into the earnings by checking this interactive graph of RB Global's earnings, revenue and cash flow.
What About Dividends?
As well as measuring the share price return, investors should also consider the total shareholder return (TSR). The TSR is a return calculation that accounts for the value of cash dividends (assuming that any dividend received was reinvested) and the calculated value of any discounted capital raisings and spin-offs. It's fair to say that the TSR gives a more complete picture for stocks that pay a dividend. We note that for RB Global the TSR over the last 5 years was 133%, which is better than the share price return mentioned above. And there's no prize for guessing that the dividend payments largely explain the divergence!
A Different Perspective
RB Global shareholders have received returns of 35% over twelve months (even including dividends), which isn't far from the general market return. That gain looks pretty satisfying, and it is even better than the five-year TSR of 18% per year. It is possible that management foresight will bring growth well into the future, even if the share price slows down. I find it very interesting to look at share price over the long term as a proxy for business performance. But to truly gain insight, we need to consider other information, too. Consider risks, for instance. Every company has them, and we've spotted 1 warning sign for RB Global you should know about.
There are plenty of other companies that have insiders buying up shares. You probably do not want to miss this free list of undervalued small cap companies that insiders are buying.
Please note, the market returns quoted in this article reflect the market weighted average returns of stocks that currently trade on American exchanges.
Have feedback on this article? Concerned about the content? Get in touch with us directly. Alternatively, email editorial-team (at) simplywallst.com.
This article by Simply Wall St is general in nature. We provide commentary based on historical data and analyst forecasts only using an unbiased methodology and our articles are not intended to be financial advice. It does not constitute a recommendation to buy or sell any stock, and does not take account of your objectives, or your financial situation. We aim to bring you long-term focused analysis driven by fundamental data. Note that our analysis may not factor in the latest price-sensitive company announcements or qualitative material. Simply Wall St has no position in any stocks mentioned.
