
 不过,分析师称,美联储11月再次降息50个基点的预期以及地缘政治紧张局势可能会给金价提供支撑,从而限制金价下跌幅度。
#GoldTechnical Analysis#24K99 News On Wednesday (September 25), during the early European session, spot gold continued to decline in the short term, with the current price falling to around $2653 per ounce; during the Asian session, it once soared to $2670.52 per ounce, hitting a historical high. FXStreet's senior analyst Dhwani Mehta wrote on Wednesday, analyzing the technical trends of gold price.
Mehta pointed out that on the daily chart, the price of gold has entered an extremely overbought state, facing the risk of adjustment.
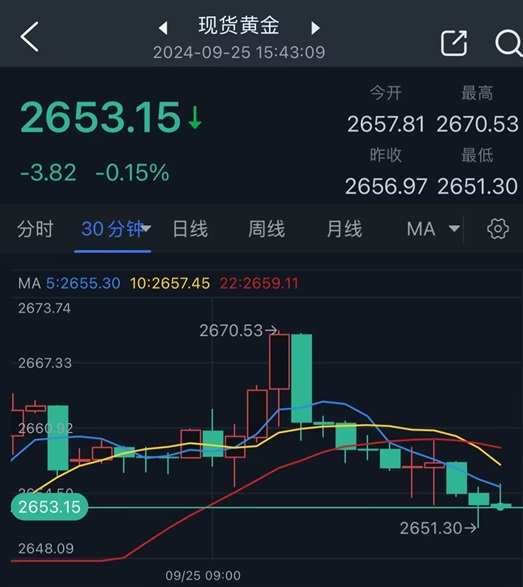
(Spot gold 30-minute chart, source: 24K99)
 However, the analyst stated that expectations of a further 50 basis point rate cut by the Federal Reserve in November and geopolitical tensions may provide support for gold prices, thereby limiting the extent of the decline in gold prices.
The CME Group's 'FedWatch' tool shows that the market currently expects a 60% probability of a 50 basis point rate cut by the Federal Reserve in November.
Mehta stated that on Wednesday, the USA did not have top-tier economic data available. However, speeches by Federal Reserve policymakers and risk trends will continue to play a crucial role in the price movement of gold. Additionally, gold traders may reposition ahead of a series of speeches by the Federal Reserve on Thursday, including a key opening statement by Federal Reserve Chairman Jerome Powell at the New York USA Treasury Market Conference.
The Federal Reserve's initiation of monetary policy easing has driven a sharp increase in the gold price in recent times, as gold does not yield interest, and rate cuts can reduce holdings of gold.opportunity cost.
Due to a large amount of funds flowing into gold etf, and major central banks expected to further lower interest rates, major investment banks predict that the record-breaking price surge in gold will continue until 2025.
How to trade gold?
Mehta pointed out that as observed on the daily chart, 14-dayRelative Strength Index(RSIHovering around 80 indicates an extremely overbought condition, suggesting a correction may be imminent.
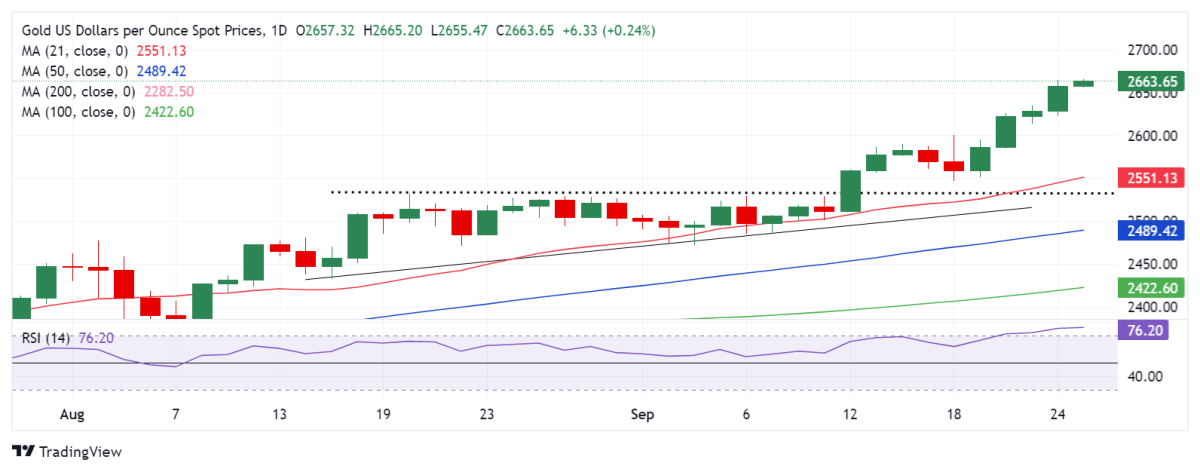
(Spot gold daily chart source: FXStreet)
Mehta said that any pullback in the price of gold could test the Tuesday low of $2623 per ounce, and once that level is breached, the $2600 per ounce mark will come into play.
If the price of gold continues to fall, gold sellers may target the September 20 low of $2585 per ounce.
On the other hand, Mehta added that if gold buyers demonstrate their strength, breaking through the $2670 per ounce level is crucial for further rise towards the $2700 per ounce barrier.
At 15:43 Beijing time, spot gold was trading at $2,653.15 per ounce.
