
It hasn't been the best quarter for HF Sinclair Corporation (NYSE:DINO) shareholders, since the share price has fallen 15% in that time. But over three years, the returns would have left most investors smiling To wit, the share price did better than an index fund, climbing 37% during that period.
So let's investigate and see if the longer term performance of the company has been in line with the underlying business' progress.
To paraphrase Benjamin Graham: Over the short term the market is a voting machine, but over the long term it's a weighing machine. One imperfect but simple way to consider how the market perception of a company has shifted is to compare the change in the earnings per share (EPS) with the share price movement.
 During three years of share price growth, HF Sinclair achieved compound earnings per share growth of 74% per year. This EPS growth is higher than the 11% average annual increase in the share price. So one could reasonably conclude that the market has cooled on the stock. This cautious sentiment is reflected in its (fairly low) P/E ratio of 7.36.
The image below shows how EPS has tracked over time (if you click on the image you can see greater detail).
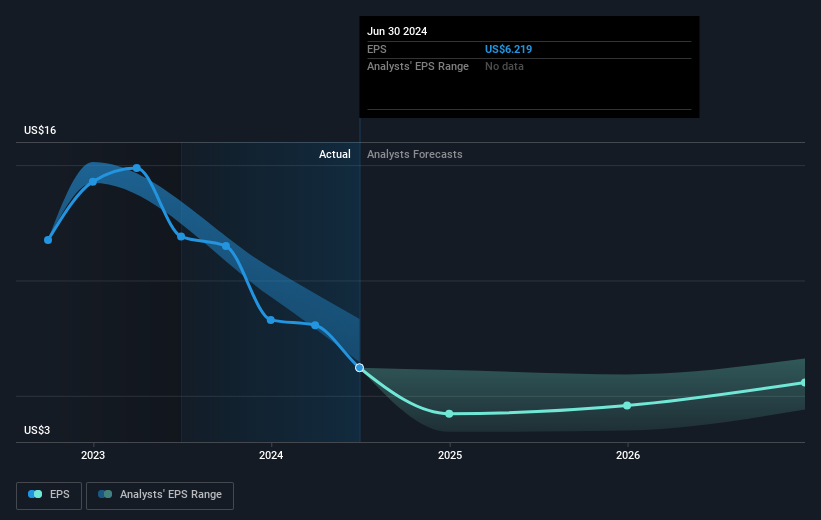
We like that insiders have been buying shares in the last twelve months. Even so, future earnings will be far more important to whether current shareholders make money. This free interactive report on HF Sinclair's earnings, revenue and cash flow is a great place to start, if you want to investigate the stock further.
What About Dividends?
When looking at investment returns, it is important to consider the difference between total shareholder return (TSR) and share price return. The TSR incorporates the value of any spin-offs or discounted capital raisings, along with any dividends, based on the assumption that the dividends are reinvested. So for companies that pay a generous dividend, the TSR is often a lot higher than the share price return. As it happens, HF Sinclair's TSR for the last 3 years was 49%, which exceeds the share price return mentioned earlier. And there's no prize for guessing that the dividend payments largely explain the divergence!
A Different Perspective
Investors in HF Sinclair had a tough year, with a total loss of 18% (including dividends), against a market gain of about 32%. Even the share prices of good stocks drop sometimes, but we want to see improvements in the fundamental metrics of a business, before getting too interested. Unfortunately, last year's performance may indicate unresolved challenges, given that it was worse than the annualised loss of 0.2% over the last half decade. We realise that Baron Rothschild has said investors should "buy when there is blood on the streets", but we caution that investors should first be sure they are buying a high quality business. While it is well worth considering the different impacts that market conditions can have on the share price, there are other factors that are even more important. Like risks, for instance. Every company has them, and we've spotted 4 warning signs for HF Sinclair (of which 1 can't be ignored!) you should know about.
HF Sinclair is not the only stock insiders are buying. So take a peek at this free list of small cap companies at attractive valuations which insiders have been buying.
Please note, the market returns quoted in this article reflect the market weighted average returns of stocks that currently trade on American exchanges.
Have feedback on this article? Concerned about the content? Get in touch with us directly. Alternatively, email editorial-team (at) simplywallst.com.
This article by Simply Wall St is general in nature. We provide commentary based on historical data and analyst forecasts only using an unbiased methodology and our articles are not intended to be financial advice. It does not constitute a recommendation to buy or sell any stock, and does not take account of your objectives, or your financial situation. We aim to bring you long-term focused analysis driven by fundamental data. Note that our analysis may not factor in the latest price-sensitive company announcements or qualitative material. Simply Wall St has no position in any stocks mentioned.
