
Capricor Therapeutics, Inc. (NASDAQ:CAPR) shareholders have had their patience rewarded with a 31% share price jump in the last month. Unfortunately, despite the strong performance over the last month, the full year gain of 7.6% isn't as attractive.
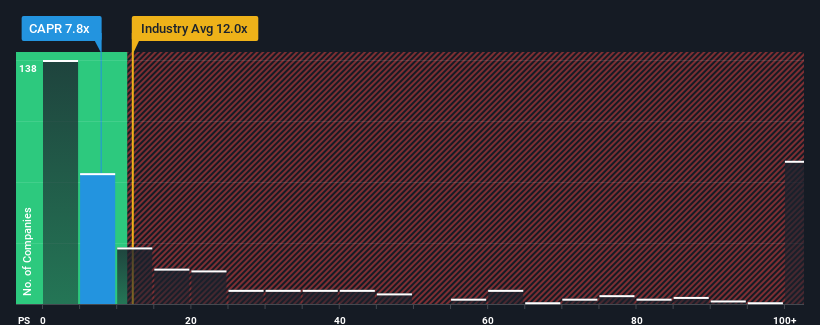
In spite of the firm bounce in price, Capricor Therapeutics' price-to-sales (or "P/S") ratio of 7.8x might still make it look like a buy right now compared to the Biotechs industry in the United States, where around half of the companies have P/S ratios above 12x and even P/S above 76x are quite common. Nonetheless, we'd need to dig a little deeper to determine if there is a rational basis for the reduced P/S.
What Does Capricor Therapeutics' P/S Mean For Shareholders?
Capricor Therapeutics certainly has been doing a good job lately as it's been growing revenue more than most other companies. It might be that many expect the strong revenue performance to degrade substantially, which has repressed the share price, and thus the P/S ratio. If not, then existing shareholders have reason to be quite optimistic about the future direction of the share price.
If you'd like to see what analysts are forecasting going forward, you should check out our free report on Capricor Therapeutics.How Is Capricor Therapeutics' Revenue Growth Trending?
 Capricor Therapeutics' P/S ratio would be typical for a company that's only expected to deliver limited growth, and importantly, perform worse than the industry.
Retrospectively, the last year delivered an exceptional 187% gain to the company's top line. The latest three year period has also seen an incredible overall rise in revenue, aided by its incredible short-term performance. Therefore, it's fair to say the revenue growth recently has been superb for the company.
Looking ahead now, revenue is anticipated to climb by 55% per year during the coming three years according to the five analysts following the company. That's shaping up to be materially lower than the 146% per annum growth forecast for the broader industry.
In light of this, it's understandable that Capricor Therapeutics' P/S sits below the majority of other companies. Apparently many shareholders weren't comfortable holding on while the company is potentially eyeing a less prosperous future.
What We Can Learn From Capricor Therapeutics' P/S?
The latest share price surge wasn't enough to lift Capricor Therapeutics' P/S close to the industry median. Typically, we'd caution against reading too much into price-to-sales ratios when settling on investment decisions, though it can reveal plenty about what other market participants think about the company.
As we suspected, our examination of Capricor Therapeutics' analyst forecasts revealed that its inferior revenue outlook is contributing to its low P/S. Right now shareholders are accepting the low P/S as they concede future revenue probably won't provide any pleasant surprises. It's hard to see the share price rising strongly in the near future under these circumstances.
Before you take the next step, you should know about the 2 warning signs for Capricor Therapeutics that we have uncovered.
It's important to make sure you look for a great company, not just the first idea you come across. So if growing profitability aligns with your idea of a great company, take a peek at this free list of interesting companies with strong recent earnings growth (and a low P/E).
Have feedback on this article? Concerned about the content? Get in touch with us directly. Alternatively, email editorial-team (at) simplywallst.com.
This article by Simply Wall St is general in nature. We provide commentary based on historical data and analyst forecasts only using an unbiased methodology and our articles are not intended to be financial advice. It does not constitute a recommendation to buy or sell any stock, and does not take account of your objectives, or your financial situation. We aim to bring you long-term focused analysis driven by fundamental data. Note that our analysis may not factor in the latest price-sensitive company announcements or qualitative material. Simply Wall St has no position in any stocks mentioned.