
If you buy and hold a stock for many years, you'd hope to be making a profit. But more than that, you probably want to see it rise more than the market average. But American Financial Group, Inc. (NYSE:AFG) has fallen short of that second goal, with a share price rise of 27% over five years, which is below the market return. However, if you include the dividends then the return is market beating. On a brighter note, more newer shareholders are probably rather content with the 21% share price gain over twelve months.
So let's investigate and see if the longer term performance of the company has been in line with the underlying business' progress.
To quote Buffett, 'Ships will sail around the world but the Flat Earth Society will flourish. There will continue to be wide discrepancies between price and value in the marketplace...' One flawed but reasonable way to assess how sentiment around a company has changed is to compare the earnings per share (EPS) with the share price.
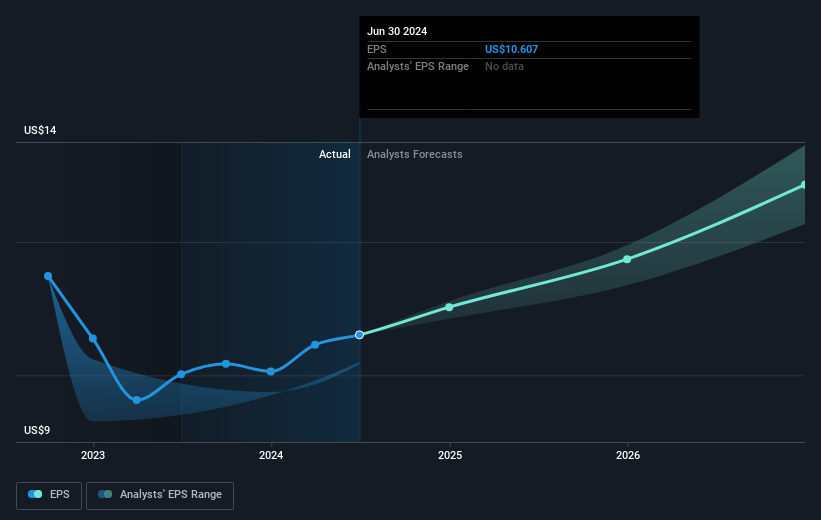
 Over half a decade, American Financial Group managed to grow its earnings per share at 5.9% a year. The EPS growth is more impressive than the yearly share price gain of 5% over the same period. Therefore, it seems the market has become relatively pessimistic about the company.
The company's earnings per share (over time) is depicted in the image below (click to see the exact numbers).
It's good to see that there was some significant insider buying in the last three months. That's a positive. That said, we think earnings and revenue growth trends are even more important factors to consider. Before buying or selling a stock, we always recommend a close examination of historic growth trends, available here..
What About Dividends?
As well as measuring the share price return, investors should also consider the total shareholder return (TSR). The TSR is a return calculation that accounts for the value of cash dividends (assuming that any dividend received was reinvested) and the calculated value of any discounted capital raisings and spin-offs. It's fair to say that the TSR gives a more complete picture for stocks that pay a dividend. In the case of American Financial Group, it has a TSR of 107% for the last 5 years. That exceeds its share price return that we previously mentioned. This is largely a result of its dividend payments!
A Different Perspective
American Financial Group shareholders gained a total return of 28% during the year. Unfortunately this falls short of the market return. The silver lining is that the gain was actually better than the average annual return of 16% per year over five year. This could indicate that the company is winning over new investors, as it pursues its strategy. It's always interesting to track share price performance over the longer term. But to understand American Financial Group better, we need to consider many other factors. To that end, you should be aware of the 1 warning sign we've spotted with American Financial Group .
American Financial Group is not the only stock that insiders are buying. For those who like to find lesser know companies this free list of growing companies with recent insider purchasing, could be just the ticket.
Please note, the market returns quoted in this article reflect the market weighted average returns of stocks that currently trade on American exchanges.
Have feedback on this article? Concerned about the content? Get in touch with us directly. Alternatively, email editorial-team (at) simplywallst.com.
This article by Simply Wall St is general in nature. We provide commentary based on historical data and analyst forecasts only using an unbiased methodology and our articles are not intended to be financial advice. It does not constitute a recommendation to buy or sell any stock, and does not take account of your objectives, or your financial situation. We aim to bring you long-term focused analysis driven by fundamental data. Note that our analysis may not factor in the latest price-sensitive company announcements or qualitative material. Simply Wall St has no position in any stocks mentioned.