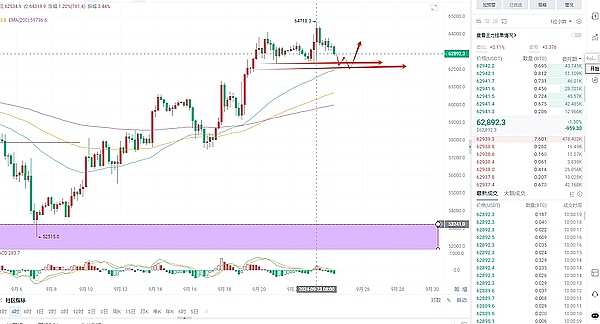
September 24 morning: bitcoin surged but was resisted: fell below 63,000, paying attention to the main resistance.
The daily chart of bitcoin closed with a doji bearish candle, rising to 64700 before falling back to around 62500 under pressure from 65000 above. The current trend on the chart shows a range-bound movement, with attention below on the daily level bull-bear dividing line at 60900. If it does not fall below this level, it will still be in an upward trend. On the 4-hour chart, focus on the support range at 62300 and 61900, considering setting a long position in this range. There is a bearish divergence pattern on the 4-hour chart, and if the MACD moving average line crosses below 0, it will trigger a pullback on the 4-hour chart.