
 比特币高位盘整周期开始了,多头受阻65000整数关口,大级别趋势看多不变,短周期出现横盘趋势,先看眼前的盘口,目前四小时K线形态在63000至64000区间内波动,形成了一个相对稳定的箱体整理形态23日08:00到12:00期间出现了一次明显的上影线较长的K线,丽盈从盘口判断上方压力有效
Coin Circle Liying: The bullish trend of 9.24 bitcoins remains! Ethereum shows a cup and handle pattern! How to deal with short-term fluctuations? Latest market analysis
Article published date: September 24, 2024 ---- 07:00.
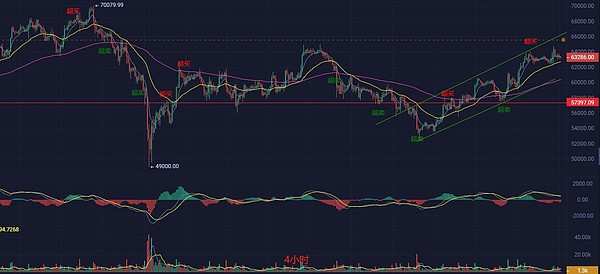
 Bitcoin has started a consolidation period at a high level, facing resistance at the key level of 65,000. The overall trend remains bullish at a high level, with a short-term sideways trend. Focus on the current market situation. Currently, the four-hour candlestick pattern fluctuates between 63,000 and 64,000, forming a relatively stable box consolidation pattern. During the period from 08:00 to 12:00 on the 23rd, a candlestick with a significantly long upper shadow line appeared. Based on the market situation, there is effective resistance above Li Ying.
The MACD technical indicator is below the zero axis, but the DIF and DEA are gradually approaching, showing a golden cross signal, indicating a possible short-term demand for a rebound. The RSI is currently around 54.3, indicating a neutral to slightly bullish sideways market sentiment. The EMA trend indicator shows a bullish alignment in the short term, but the long-term trend remains positive. In the short term, the sideways trend is basically confirmed, with strong resistance above and some support below. In terms of strategy, it is recommended to sell short on rallies and buy on dips with a flexible and adaptable conventional approach.
Today's reference point: Trend (sideways)
Long at 63,000, defense at 62,500, stop loss at 62,000, target at 64,500
Short at 64,500, defense at 65,000, stop loss at 65,500, target at 63,000
Ethereum

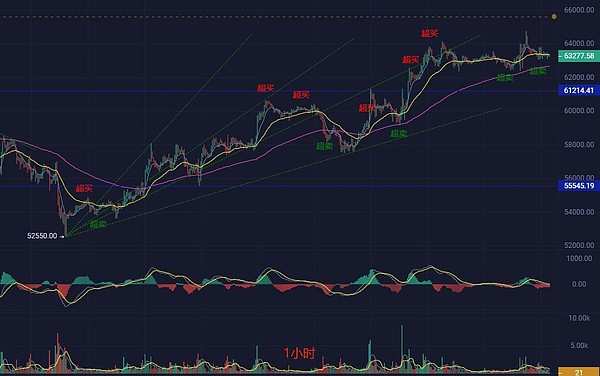
On a large scale, Ethereum is showing a cup and handle pattern, indicating an increased probability of impacting the 2820 resistance level. Following two consecutive attempts above 2700, it has retraced. The 4-hour candlestick pattern fluctuates between 2600 and 2700, forming a consolidation pattern. On the 23rd at 08:00, a long bullish candle appeared, followed by subsequent candles oscillating at higher levels.

Technical indicator MACD: currently, DIF and DEA are both positive, and the MACD histogram indicates strong bullish momentum but with signs of weakening. The probability of consolidation increases, focusing on the key support level. RSI14 is currently at 64.7, with a risk of pullback. EMA7 is very close to the latest price, likely to provide support; EMA30 and EMA120 are diverging upwards, indicating a bullish medium to long-term trend, while short-term is consolidating.
Liyin's latest reference points today (consolidation)
Long entry point at 2620, averaging down point at 2560, stop-loss point at 2520, target at 2700.
Short entry point at 2700, averaging up point at 2800, stop-loss point at 2830, target at 2600.
The content of the article is for reference only, subject to change, risk is self-accepted.
The above analysis and conclusions drawn by Lijing based on market data and trend analysis of the order book, are for reference only and do not constitute investment advice.
