
Passive investing in index funds can generate returns that roughly match the overall market. But in our experience, buying the right stocks can give your wealth a significant boost. For example, the The Williams Companies, Inc. (NYSE:WMB) share price is up 89% in the last five years, slightly above the market return. We're also happy to report the stock is up a healthy 34% in the last year.
Now it's worth having a look at the company's fundamentals too, because that will help us determine if the long term shareholder return has matched the performance of the underlying business.
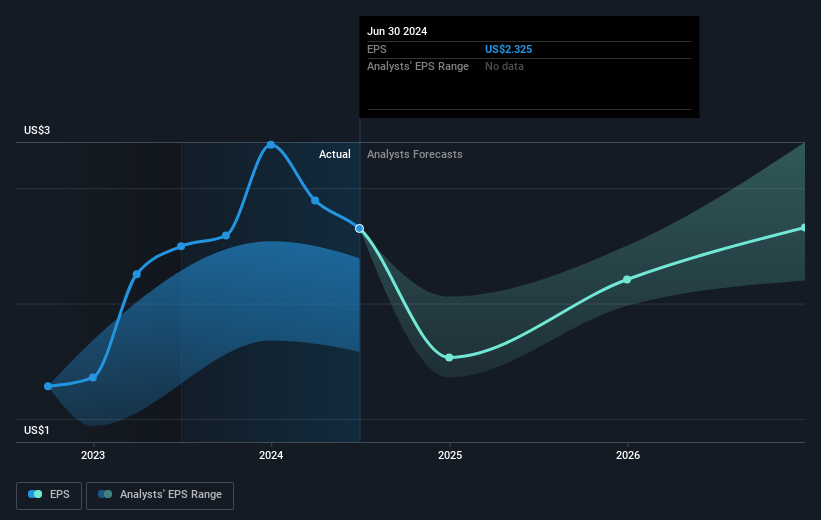
To paraphrase Benjamin Graham: Over the short term the market is a voting machine, but over the long term it's a weighing machine. One flawed but reasonable way to assess how sentiment around a company has changed is to compare the earnings per share (EPS) with the share price.
 During five years of share price growth, Williams Companies achieved compound earnings per share (EPS) growth of 114% per year. This EPS growth is higher than the 14% average annual increase in the share price. So it seems the market isn't so enthusiastic about the stock these days.
The graphic below depicts how EPS has changed over time (unveil the exact values by clicking on the image).
It is of course excellent to see how Williams Companies has grown profits over the years, but the future is more important for shareholders. If you are thinking of buying or selling Williams Companies stock, you should check out this FREE detailed report on its balance sheet.
What About Dividends?
When looking at investment returns, it is important to consider the difference between total shareholder return (TSR) and share price return. Whereas the share price return only reflects the change in the share price, the TSR includes the value of dividends (assuming they were reinvested) and the benefit of any discounted capital raising or spin-off. So for companies that pay a generous dividend, the TSR is often a lot higher than the share price return. As it happens, Williams Companies' TSR for the last 5 years was 155%, which exceeds the share price return mentioned earlier. And there's no prize for guessing that the dividend payments largely explain the divergence!
A Different Perspective
It's good to see that Williams Companies has rewarded shareholders with a total shareholder return of 40% in the last twelve months. And that does include the dividend. That's better than the annualised return of 21% over half a decade, implying that the company is doing better recently. Given the share price momentum remains strong, it might be worth taking a closer look at the stock, lest you miss an opportunity. While it is well worth considering the different impacts that market conditions can have on the share price, there are other factors that are even more important. For example, we've discovered 2 warning signs for Williams Companies that you should be aware of before investing here.
We will like Williams Companies better if we see some big insider buys. While we wait, check out this free list of undervalued stocks (mostly small caps) with considerable, recent, insider buying.
Please note, the market returns quoted in this article reflect the market weighted average returns of stocks that currently trade on American exchanges.
Have feedback on this article? Concerned about the content? Get in touch with us directly. Alternatively, email editorial-team (at) simplywallst.com.
This article by Simply Wall St is general in nature. We provide commentary based on historical data and analyst forecasts only using an unbiased methodology and our articles are not intended to be financial advice. It does not constitute a recommendation to buy or sell any stock, and does not take account of your objectives, or your financial situation. We aim to bring you long-term focused analysis driven by fundamental data. Note that our analysis may not factor in the latest price-sensitive company announcements or qualitative material. Simply Wall St has no position in any stocks mentioned.
