
 2024年8月中国汽车出口总量的前10国家:俄罗斯130948辆、墨西哥52640辆、阿联酋28576辆、沙特21836辆、比利时19752辆、菲律宾14609辆、美国14064辆、意大利14005辆、马来西亚13224辆、英国12670辆;8月中国汽车出口增量的前五国家:俄罗斯50872辆、墨西哥18185辆、阿联酋16171辆、比利时13610辆、沙特8116辆。
Cui Dongshu of the China Passenger Car Association stated that in August 2024, China's autos achieved exports of 0.61 million units, with a year-on-year growth rate of 39% in August 2023, a 10% increase from the previous month, showing very good trends.
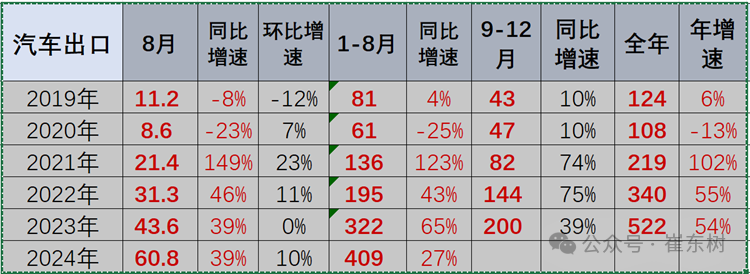
According to the Wise Finance APP, Cui Dongshu of the China Passenger Car Association stated that in August 2024, China's autos achieved exports of 0.61 million units, with a year-on-year growth rate of 39% in August 2023, a 10% increase from the previous month, showing very good trends. From January to August, China's autos achieved exports of 4.09 million units, with a 27% export growth rate. The main driving forces this year are still the improvement in China's product competitiveness, the slight growth in the Central and South American markets, and the comprehensive replacement of Russian market international brands by Chinese cars under the Russia-Ukraine crisis, especially the increased export competitiveness of China's conventional fuel vehicles.
The main driving forces this year remain the improvement of China's product competitiveness, the slight growth in the Central and South American markets, and the comprehensive replacement of international brands in the Russian market under the Russia-Ukraine crisis, especially the increased export volume brought about by the improved export competitiveness of China's conventional fuel vehicles. From January to August 2024, exports of new energy passenger vehicles reached 1.31 million units, a 25% increase year-on-year, accounting for 98% of the total volume of new energy vehicle exports. In August 2024, the export volume of new energy vehicles was 0.18 million units, with a year-on-year growth rate of 20.9%, a 2.9% increase from the previous month. From January to August 2024, the cumulative export volume of new energy vehicles reached 1.397 million units, a 24.9% year-on-year increase.
 The top 10 countries by total export volume of China's autos in August 2024: Russia 130,948 units, Mexico 52,640 units, UAE 28,576 units, Saudi Arabia 21,836 units, Belgium 19,752 units, the Philippines 14,609 units, USA 14,064 units, Italy 14,005 units, Malaysia 13,224 units, UK 12,670 units. The top five countries by export volume increase in August 2024: Russia 50,872 units, Mexico 18,185 units, UAE 16,171 units, Belgium 13,610 units, Saudi Arabia 8,116 units.
The top 10 countries by total export volume of China's autos from January to August 2024: Russia 705,514 units, Mexico 323,540 units, UAE 203,048 units, Brazil 192,254 units, Belgium 182,504 units, Saudi Arabia 161,261 units, UK 137,925 units, Australia 118,888 units, the Philippines 104,402 units, Turkey 95,650 units. The top five countries by export volume increase from January to August 2024: Russia 161,695 units, Brazil 136,511 units, UAE 105,043 units, Mexico 65,306 units, Kyrgyzstan 37,516 units. The contribution of the top 5 countries with increased volume accounts for 62%, with Russia making a significant contribution to exports. From January to August 2024, markets like Australia, Thailand, Ecuador, France, etc., experienced significant declines; Central Asia and the Russian markets showed relatively strong performance, while Brazil and Russia became core markets for increased volume.
In 2023, the markets with relatively higher increments are Russia, Central Asia, North America, and Asia. Recently, Russia, Mexico, Brazil, and others have been very strong. Overall, the global pandemic has brought certain promotion to China's export market for autos, with certain incremental exports to various countries due to overseas conflicts and the improved cost-effectiveness of Chinese autos.
Top 10 countries in total export volume of new energy vehicles from China in August 2024: Belgium 18,089 units, Mexico 12,458 units, Thailand 11,101 units, Canada 9,399 units, the Philippines 9,350 units, India 9,306 units, Indonesia 7,534 units, Germany 7,411 units, Slovenia 6,077 units, Israel 5,820 units; The top five countries with the highest year-on-year increase in China's new energy vehicle exports in August compared to August 2023: Belgium 13,816 units, Mexico 10,928 units, Slovenia 4,651 units, Indonesia 4,201 units, and Turkey 3,573 units.
The top 10 countries in total new energy vehicle exports from January to August 2024 are: Belgium 170,876 units, Brazil 136,112 units, United Kingdom 88,933 units, Thailand 81,546 units, Philippines 69,987 units, Mexico 61,647 units, India 53,738 units, Australia 51,843 units, United Arab Emirates 47,716 units, Germany 41,105 units; The top five countries in the export growth of new energy vehicles from China from January to August are: Brazil 106,171 units, Mexico 53,792 units, United Arab Emirates 27,870 units, Indonesia 27,674 units, Belgium 26,145 units, with the top 5 countries contributing 98% of the export growth, with Brazil making a huge contribution.
The driving forces behind export growth are divine intervention, high quality, human effort, and geopolitical changes. Firstly, divine intervention - the Chinese automotive industry chain is resilient; secondly, high quality - the contribution of new energy to exports is increasing; thirdly, human effort - independent brand enterprises are working hard; fourthly, geopolitical changes - comprehensive development of China's exports.
China's export of new energy vehicles to developed markets is showing a trend of high-quality development, mainly exporting to Western Europe and Southeast Asia markets. In recent years, developed countries in Western and Southern Europe such as Belgium, Spain, Slovenia, and the United Kingdom have continued to be export highlights, with a slight decline in August. Export to countries in the Americas like Brazil has been strengthening this year. Independent brands such as SAIC Passenger Vehicle and BYD's new energy models have shown strong performance. Although the export of new energy vehicles to Europe slowed down in August, it is expected to rebound as China adapts gradually to the impact of anti-subsidy actions in Europe.
1. Overall Trends in China's Automobile Exports
1. Historical Trend of Automobile Exports
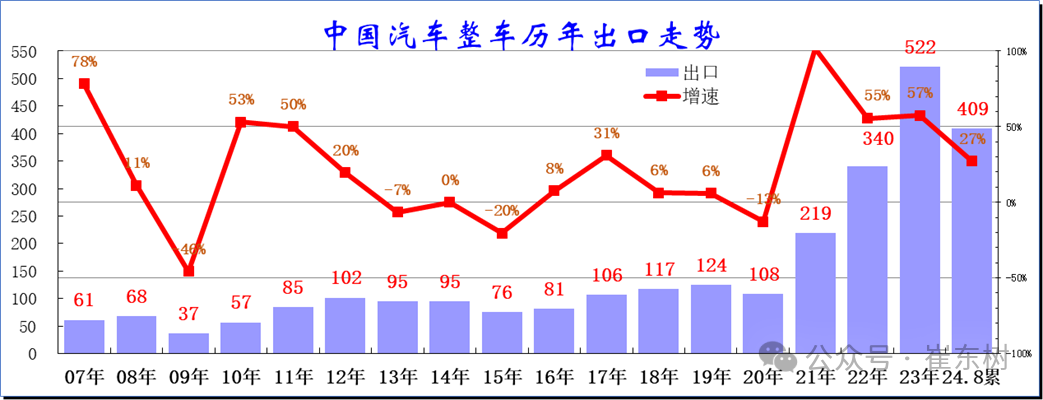
China's automobile exports have experienced a platform period of millions of units for many years, finally breaking through in 2021. After a sharp decline during the global economic downturn from 2013 to 2016, export growth stabilized and improved from 2017 to 2020, with annual export volume maintained at around 1 million units. In 2020, exports reached 1.08 million units, a 13% year-on-year decrease, followed by entering a period of high growth.
Due to the impact of the global pandemic and the localization of Tesla, China's automobile exports achieved a huge breakthrough in sales volume and unit price from 2021 to 2023. In 2023, China's automobile exports reached 5.22 million units with a sustained strong growth rate of 54%. From January to August 2024, China's automobile exports reached 4.09 million units, a 27% year-on-year growth. As long as there is a stable market environment internationally, there is still tremendous potential for the future development of China's automobile exports.
In 2020, the annual sales volume reached 1.085 million units, a 13.1% year-on-year decrease. In 2021, the export market sales volume was 2.187 million units, a 102% year-on-year increase.
In 2022, the export market sales volume was 3.4 million units, a 55% year-on-year increase, mainly due to insufficient overseas supply and a significant enhancement of competitiveness of Chinese automotive exports. In 2023, China's automotive exports reached 5.22 million units, with a continuous strong growth in export speed of 54%, showing super performance. Compared to the gradual recovery of domestic automotive sales, the export market performance remains strong. The significant growth of China's exports in the past two years has been under the backdrop of international pandemics and the Russia-Ukraine crisis.
In August 2024, Chinese autos achieved an export of 0.61 million units, with a 39% year-on-year growth rate compared to August 2023, and a 10% month-on-month growth, showing a positive trend. From January to August 2024, Chinese autos achieved an export of 4.09 million units, with an export growth rate of 27%. The main driving force this year continues to be the improvement of China's product competitiveness, a slight increase in the European and American markets, and the complete replacement of international brands in the Russian market due to the Russia-Ukraine crisis, especially the increased export competitiveness brought about by the improvement of China's rbob gasoline vehicle exports.
2. Trends in monthly exports of complete vehicles

From the monthly trends, in recent years exports still show seasonal characteristics, with high levels in summer and contrasting trends compared to the domestic market. In 2022, the automotive market showed a strong start, but due to the impact of the Shanghai epidemic, exports declined month by month from April to May, with a continuous increase from May to December. In 2023, exports continued to be strong, maintaining the sales volume of the fourth quarter of 2022, reflecting a significant increase in the global competitiveness of China's automotive industry.
From January to August 2024, Chinese auto exports basically follow the monthly trends of previous years. The growth rate in the first quarter has slowed down compared to the previous three years' very high growth rates, with a recovery in growth rate in April and May, weakness in June, and export growth resuming in August. Exports in January and February of this year only increased by 20%, while March to May saw an increase of over 30%. Auto exports have shown strength in the recent complex external environment.
3. Characteristics of the export structure of complete vehicles.

Exports maintained at a million scale before 2020. In 2021, total vehicle exports (including chassis) reached 2.19 million units, with a growth rate of 102%, which is considered very good. The standout performers in exports from 2021 to 2022 are 4WD SUVs and other passenger vehicles.
In 2023, the export of automobiles is comprehensively strengthening, with strong performance in fuel cars. Passenger vehicles are the main force in exports, growing at a rate of 65%, with good export performance of 4WD SUVs and minibuses.
In 2024, the growth rate of the Russian market demand weakened, but passenger vehicle exports showed strong resilience. The exports of trucks, buses, and special vehicles were somewhat weak, with a stabilization trend in passenger vehicle exports in August with a 40% increase.
This year, truck exports increased by 9% at customs, relatively lower than the sluggish domestic truck market. Recently, various types of truck exports have been more differentiated, with better performance in medium and heavy truck exports.

From a structural perspective, the proportion of passenger vehicle exports continues to increase, while the proportion of trucks and buses has significantly decreased. Several main types of passenger vehicles have balanced performance. The export of small cars decreased, with the proportion of buses with less than 9 seats reaching the highest at 32% in 2024, reaching 35% in August.
The performance of light trucks in the truck segment is good, while the performance of tractor exports has declined. In the passenger vehicle segment, large and medium-sized buses are warming up, while light buses are slightly weaker.
4. Characteristics of export power structure

In 2024, the export growth rate of passenger vehicles rebounded, with July and August performing better than the first half of the year. In August 2024, pure electric passenger vehicle exports declined, while plug-in hybrids and hybrid vehicles were strong. Gasoline passenger vehicle exports were strong from January to August. This year, exports of trucks and buses were sluggish, but exports of gasoline trucks and light buses showed relatively strong trends, with a shift in growth momentum.
II. Pattern of Automobile Export Market
1. Characteristics of export manufacturers in domestic regions

In August, Anhui replaced Shanghai as the leader in national automobile exports. Shanghai's significant importance in China's exports is evident, with Shanghai exporting 0.95 million vehicles in 2023. This is mainly due to the relatively excellent local enterprises in Shanghai, especially SAIC passenger vehicles and Tesla, both of which have strong export volumes. SAIC General Motors' export performance is stable. However, Shanghai's recent exports have been unusually low, dropping to 0.53 million vehicles in January-August 2024, a 14% decrease, with a 36% increase in August.
anhui's export performance is relatively strong, mainly due to chery's strong export performance. The contribution of automobile exports from shaanxi, hebei, and jiangsu has increased significantly.
2. Analysis of regional export trends

In January to August 2024, the pure electric vehicle exports to oceania and europe slowed significantly, but remained strong in other regions. The red sea crisis has little impact on China's exports, but EU policies have caused a slight decrease in China's new energy exports. The growth in August is the result of exploring markets in africa, south america, the middle east, and other regions.

From a sales perspective, exports from 2017 to 2023 have been gradually recovering, mainly due to Europe's contribution. In 2024, the EU's proportion decreased, while exports to central and south america and the usa and canada increased. In August, the export proportion of new energy vehicles to japan and south korea reached 50%, far exceeding other regions. Recently, the market share in developed markets in europe and north america has decreased, and the market performance in developed countries has declined.
South America's new energy exports have shown significant fluctuations. The export demand from poor and underdeveloped regions in the world is unstable and unsustainable.
3. Analysis of the trend of complete vehicle exports by country.

In 2021, the average export price was 0.016 million USD, in 2022, the average car export price was 0.018 million USD, rising to 0.019 million USD in 2023, and this year's average export price is 0.019 million USD, almost flat compared to last year.
Due to significant changes in the Russian market and the withdrawal of other foreign investments, China has increased its exports to Russia since 2023. Last year, the exports were mainly to Belgium. This year, with the economic downturn in Europe, the export performance is average.
In 2023, the car markets in Chile, Peru, etc., experienced a sharp decline, while markets like Brazil and Turkey showed some recovery with significant fluctuations in the Brazilian market. Asia remains important for Saudi Arabia and Bangladesh markets. The recent performance in the Mexican market has been strong, unaffected by tariffs imposed by Europe and the USA.
4. Trend of Monthly Changes in Vehicle Exports

The top 10 countries for China's total automotive exports in August 2024 were: Russia with 130,948 vehicles, Mexico with 52,640 vehicles, UAE with 28,576 vehicles, Saudi Arabia with 21,836 vehicles, Belgium with 19,752 vehicles, the Philippines with 14,609 vehicles, USA with 14,064 vehicles, Italy with 14,005 vehicles, Malaysia with 13,224 vehicles, and the UK with 12,670 vehicles. The top five countries contributing to the increase in China's automotive exports in August were: Russia with 50,872 vehicles, Mexico with 18,185 vehicles, UAE with 16,171 vehicles, Belgium with 13,610 vehicles, and Saudi Arabia with 8,116 vehicles. From January to August 2024, the top 10 countries in terms of total vehicle exports were: Russia with 705,514 vehicles, Mexico with 323,540 vehicles, UAE with 203,048 vehicles, Brazil with 192,254 vehicles, Belgium with 182,504 vehicles, Saudi Arabia with 161,261 vehicles, the UK with 137,925 vehicles, Australia with 118,888 vehicles, the Philippines with 104,402 vehicles, and Turkey with 95,650 vehicles. The top five countries contributing to the increase in China's automotive exports from January to August were: Russia with 161,695 vehicles, Brazil with 136,511 vehicles, UAE with 105,043 vehicles, Mexico with 65,306 vehicles, and Kyrgyzstan with 37,516 vehicles. The contribution of the top five countries in incremental exports accounts for 62%, with Russia playing a significant role. From January to August 2024, markets like Thailand, Ecuador, and France experienced significant declines, while the Central Asian and Russian markets performed relatively strongly. Brazil and Russia emerged as core markets for incremental growth.
In 2023, the markets with relatively higher increases included Russia, Central Asia, North America, and Asia, with recent strength seen in Russia, Mexico, and the UAE. Overall, the global pandemic has somewhat promoted China's automotive exports, and due to overseas conflicts and the improved cost-effectiveness of Chinese cars, there has been an increase in exports to various countries.
5. Analysis of changes in main export countries over the years

The previous overseas bases for car exports did not perform well, in 2020, the main countries for car exports were Saudi Arabia, Bangladesh, Egypt, Chile, etc., with significant fluctuations.
In 2022, the main markets for car exports come from Mexico, Saudi Arabia, Chile, Belgium, Australia, the Philippines, Russia, etc., with many non-developed countries.
In 2023, the main markets for car exports are Russia, Mexico, Belgium, Australia, Saudi Arabia, the United Kingdom, etc., with strong trends in the European and American markets. Recently, relatively developed countries such as Australia, Belgium, and the United Kingdom have shown improved performance.
In 2024, there is a structural change in car exports, with Russia and Mexico remaining the top two unchanged, Belgium recovering, Brazil's exports sharply declining, and exports to the United Arab Emirates and Saudi Arabia increasing.
6. Analysis of changes in exports to Russia

In 2022, china exported 0.16 million vehicles to russia, and in 2023, china's automobile exports to russia reached 0.91 million units, a year-on-year increase of 459%. From January to August 2024, china exported 0.71 million vehicles to russia, a 30% increase compared to the same period. Since 2023, russia has suddenly become china's largest market for automobile exports, marking a major change in china's automobile export market once again after 15 years. In 2008, china's domestic brands performed well in the russian market, but with russia’s hefty tariffs on chinese automobiles, many chinese auto companies withdrew from russia that year.

Recently, due to the withdrawal of automobile enterprises from other countries, chinese enterprises swiftly ensured the supply of vehicles to russia in 2023. Currently, chinese companies in russia should be temporarily safe, but caution is still needed.

In 2024, china's exports of new energy vehicles to russia experienced drastic fluctuations, while russia's import rules were constantly adjusted based on supply and demand.
After the sharp increase in exports of trucks and heavy-duty vehicles in china in 2024, there has been a recent rise in the export volume of passenger vehicles.
3. Trends in the export of new energy vehicles
1. Characteristics of annual exports of complete new energy vehicles

As China's domestic new energy vehicle market transitions from subsidy-driven to market-driven, the market competitiveness of Chinese new energy vehicles has significantly increased. The export of Chinese new energy vehicles surged in 2021 and then entered a sustained high-growth range. Despite being affected by EU policies on exporting new energy vehicles this year, China's new energy vehicle exports still reached 1.4 million units from January to August 2024, a year-on-year increase of 25%.

In August 2024, the export volume of new energy vehicles was 0.18 million units, with a year-on-year growth rate of 20.9% and a month-on-month growth rate of 2.9%. From January to August 2024, the cumulative export volume of new energy vehicles reached 1.397 million units, a year-on-year growth of 24.9%.
2. Characteristics of the export structure of complete new energy vehicles

Before 2019, the export volume of new energy vehicles was relatively large, but passenger vehicles were mainly micro low-speed electric vehicles, and the actual mainstream new energy vehicle models were not many. The export structure and quantity of new energy passenger vehicles have shown improvement. The export performance of new energy vehicles was good from 2020 to 2022, with a cumulative export of new energy vehicles reaching 1.73 million units in 2023.
In August 2024, the export of new energy vehicles was 0.172 million units, a year-on-year increase of 20%; from January to August, the export of new energy vehicles was 1.34 million units, a year-on-year increase of 24%; from January to August 2024, the export of new energy passenger vehicles was 1.31 million units, a year-on-year increase of 25%, accounting for 98% of the total export volume of new energy vehicles. Recently, the export of new energy buses and special vehicles has declined rapidly, with the export growth rate of new energy buses from January to August sharply slowing to 0.006 million units, a 3% decrease.
Analysis of changes in new energy export regions.

With Tesla's entry into China, the pattern of Chinese car exports has changed. Shanghai has been the long-term leader, but its exports have sharply declined due to temporary obstacles from the European Union's entry. In 2024, the regions with strong new energy car exports are Guangdong, Shaanxi, Hebei, Jiangsu, etc.
From the current export increment perspective, Shaanxi and Anhui have relatively large increments.
Characteristics of annual exports of new energy passenger vehicles by country.

In 2022, the export of new energy vehicles increased by 90% year-on-year. The main export markets for new energy vehicles are Europe and Asia.
In 2023, China's new energy passenger car exports reached 1.73 million units, achieving a strong growth of 55%. From January to August 2024, the export of new energy cars reached 1.34 million units, a 24% increase, and the performance of August's 20% increase is relatively average.

This year, China's exports of new energy vehicles to European countries such as Belgium and the Netherlands have gradually improved, especially in August, where exports to Belgium increased year-on-year, while exports to Brazil's new energy vehicles declined significantly. Australia's new energy exports have sharply decreased, with recent trends showing stabilization in exports to Israel, where Chinese cars still have a strong advantage.
Analysis of the changes in the export volume of new energy vehicles in 2024

Top 10 countries in total export volume of new energy vehicles from China in August 2024: Belgium 18,089 units, Mexico 12,458 units, Thailand 11,101 units, Canada 9,399 units, the Philippines 9,350 units, India 9,306 units, Indonesia 7,534 units, Germany 7,411 units, Slovenia 6,077 units, Israel 5,820 units; The top five countries with the highest year-on-year increase in China's new energy vehicle exports in August compared to August 2023: Belgium 13,816 units, Mexico 10,928 units, Slovenia 4,651 units, Indonesia 4,201 units, and Turkey 3,573 units.
Top 10 countries in total export volume of new energy vehicles from China from January to August 2024: Belgium 170,876 units, Brazil 136,112 units, the United Kingdom 88,933 units, Thailand 81,546 units, the Philippines 69,987 units, Mexico 61,647 units, India 53,738 units, Australia 51,843 units, the United Arab Emirates 47,716 units, Germany 41,105 units; The top five countries in the increase in China's new energy vehicle exports from January to August, contributing 98% to the total increase: Brazil 106,171 units, Mexico 53,792 units, the United Arab Emirates 27,870 units, Indonesia 27,674 units, Belgium 26,145 units, with Brazil making a huge contribution to exports. Export directions for 2024 include Belgium, the United Kingdom, and other European countries, as well as Brazil, Thailand, and other Southeast Asian countries as major targets. Recent market exports to the Netherlands, the United Kingdom, France, among others, have been weak. Non-EU European countries and Mexico, Thailand, Turkey, and other markets have shown strong performance.
Analysis of the changes in the export volume of pure electric passenger vehicles in 2024

In 2022, the proportion of China's new energy vehicles exported to the European Union reached a peak of 46%, with the recent decline in the proportion of pure electric vehicle exports to Europe, Central and South America. The pure electric vehicle exports in Southeast Asia have been showing continued strength recently.
6. Analysis of the changes in the export of plug-in hybrid passenger vehicles in 2024

The demand for plug-in hybrids in the former Soviet Union region is growing rapidly, while the demand for Chinese plug-in hybrid models in the European Union region has sharply decreased. Brazil's demand has recently weakened.
IV. Trends in the export of passenger vehicles by category
Passenger vehicles are exported by displacement.

The majority of passenger vehicle exports are in the 1 to 1.5-liter range, which is also the comprehensive product advantage of China's independent passenger vehicles. Recently, the export of 1.5 to 2-liter models has grown rapidly, indicating more demand for China's high-end and high-priced vehicle models from countries like Russia.
The product differentiation of electric vehicle models is significant, with a significant improvement in the export of high-end electric vehicles, while the export growth of entry-level plug-in hybrids is good.
2. Features of passenger vehicle export structure

Strong export performance of Chinese gasoline passenger vehicles from January to August 2024 was observed in countries such as Russia, the United Arab Emirates, Brazil, the USA, and Turkey. The main declining markets in 2024 are Australia, Uzbekistan, and Ecuador.

The main growth markets for Chinese pure electric passenger vehicles from January to August 2024 are Brazil, Belgium, Indonesia, Mexico, etc. The declining markets include Spain, Thailand, the Netherlands, Australia, and Slovenia.

The main incremental markets for plug-in hybrids are Brazil, Mexico, Central Asia, and other markets. The declining markets for plug-in hybrids are Belgium, France, Israel, Japan, etc.
V. Trends in Truck Export Classifications
1. Truck exports

In recent years, the growth rate of the truck market exports has not been strong, with the share of the automotive export market continuously showing a small decline.
The main force in the truck market is the strong demand for gasoline and diesel trucks under 5 tons, and overall there is also strong demand for diesel heavy-duty trucks over 20 tons.
2. Characteristics of changes in the truck export market

The top-performing truck export markets overall remain stable. In 2024, major export markets such as Mexico, Algeria, and Russia performed well. Truck exports to markets like Turkey declined, but the decline was very small.

The overall performance of the export market for new energy pure electric trucks remains stable in the top few positions, with significant exports to Mexico, South Korea, Thailand, but overall not mainstream products.
The performance of the export market for new energy trucks to Europe has been poor, with a sustained decline at present.
VI. Trends in classified bus exports
1. Bus exports

In recent times, there has been a certain decline in global bus demand, leading to the continuous shrinkage of Chinese bus exports in the past two years, dropping from 0.064 million units in 2019 to 0.037 million units in 2021.
Since 2023, global demand has been recovering, with China's bus exports in 2023 increasing to 0.071 million units. By August 2024, it reached 0.05 million units, growing by 10%.
In 2024, the performance of pure electric passenger vehicle exports dropped by 10%, which is poor, while gasoline passenger vehicle exports increased significantly. After all, our passenger vehicle exports are mainly to underdeveloped countries.
2. Characteristics of the changes in the bus export market

China's bus export main markets are relatively scattered, mainly in underdeveloped countries, with a complex market and difficult to carry out exports in an orderly and sustainable manner.
This year, there is a large demand from Saudi Arabia, Ecuador, and Southeast Asian countries. Countries with strong demand for passenger vehicles include Saudi Arabia, Peru, Vietnam, Russia, Mexico, and others. The export growth this year is in markets like Saudi Arabia, Nicaragua, Kuwait, and the shrinking markets are in developing countries such as South Africa. The decline is significant in markets like South Africa.

The export market for new energy passenger vehicles is relatively small, with significant data fluctuations. Regions like Thailand perform poorly. Strong export destinations for passenger vehicles include Nepal, South Korea, and Japan. Overseas demand for Chinese passenger vehicle electrification is not very high.