
 现货黄金周五收盘暴涨34.42美元,涨幅1.33%,报2620.91美元/盎司。金价周五最高触及2625.81美元/盎司,创下历史新高。
#GoldTechnical AnalysisOn Friday (September 20), spot gold surged nearly $35, hitting a record high. Analyst Nicholas Kitonyi from the well-known financial website FXDailyReport wrote an article on Friday analyzing the future trend of gold.
Kitonyi stated that on Friday, the price of gold rebounded from around $2587 per ounce to above approximately $2620 per ounce. In the 60-minute chart, the gold price is trading within an ascending channel. ResistanceKitonyi added that the price of gold has now risen above the 100-hour moving average. Therefore, the gold price is in the process of entering the 14-hour
Kitonyi concluded that the price of gold has already risen above the 100-hour moving average. Therefore, the gold price is currently in the process of entering the 14-hour Relative Strength Index(RSINear the overbought level.
 Spot gold soared $34.42 to close at 2620.91 per ounce on Friday, up 1.33%. The price of gold touched a high of 2625.81 per ounce on Friday, setting a new record.
Spot gold closed sharply up $42.23 this week, up 1.64%.
Will Rhind, founder of GraniteShares Advisors, said the start of the Fed's rate-cutting cycle means rates are falling, and the dollar will begin to weaken. Rhind said: "This is beneficial for gold. The next stimulus for gold will be if people feel we are entering a recession, fear factors emerge, and people need to start buying gold as a hedge.
Alex Ebkarian, Chief Operating Officer of Allegiance Gold, said: "The market is considering larger and more rate cuts, as both our finances and trade are in deficit, and this will further weaken the overall value of the dollar. The combination of geopolitical risks with our current deficits, low yield environment, and weak dollar will all lead to an increase in gold prices."
Forex.com analyst Fawad Razaqzada's report suggests: "Geopolitical risks, such as ongoing conflicts in Gaza, Ukraine, and other places, will ensure the maintenance of safe-haven demand for gold."
Two pictures of the technical prospects of gold
In terms of short-term trends, Kitonyi states that from technical aspectsLooking at it, based on the 60-minute gold trend chart, the gold price is trading within an upward channel. The 14-hour Relative Strength Index (RSI) supports a short-term call bias, with the indicator approaching overbought territory.
Therefore, gold bulls will seek for the gold price to continue its current upward trend and rise towards $2654 per ounce, or even higher towards $2691 per ounce.
On the other hand, gold bears will seek to take profits when the gold price falls to around $2587 per ounce, or even lower to $2551 per ounce.
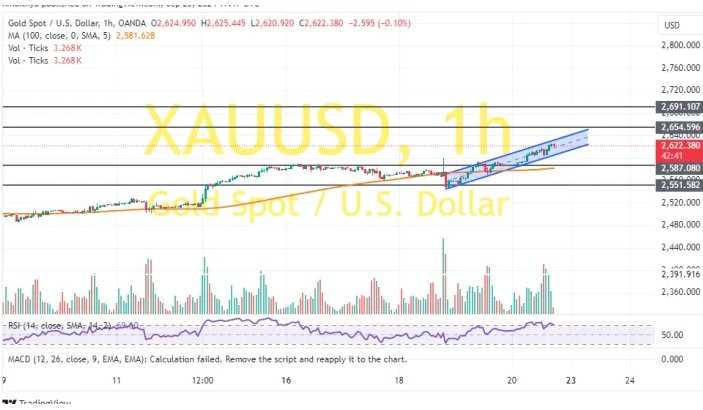
(Spot gold 60-minute chart source: FXDailyReport)
Kitonyi pointed out that, on the daily chart, the price of gold is also trading within an ascending channel. The 14-day RSI supports a bullish bias, with the index on the edge of entering overbought territory.
Therefore, in the long term, gold bulls will seek the price to continue its current rebound trend and rise towards around $2728 per ounce, or even higher to $2841 per ounce.
On the other hand, bears will seek gold to fall back to around $2495 per ounce, or even lower to $2385 per ounce to take profits.
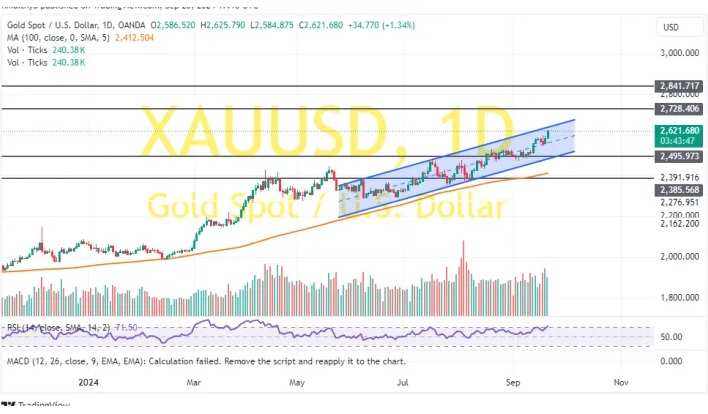
(Spot gold daily chart source: FXDailyReport)