

#GoldTechnical Analysis#24K99 News On Friday (September 20th), spot gold surged nearly $35, hitting a historical high. FXStreet analyst Eren Sengezer wrote an article on Friday analyzing the trend of gold prices next week.
Spot gold soared $34.42 to close at 2620.91 per ounce on Friday, up 1.33%. The price of gold touched a high of 2625.81 per ounce on Friday, setting a new record.
Sengezer pointed out that due to the Fed's decision to cut interest rates by 50 basis points, the US dollar faced huge selling pressure, causing gold prices to rebound to a historical high above $2600 per ounce.
 Sengezer stated that recent technical outlook indicates that gold prices are approaching overbought levels. Speeches by Fed officials and Personal Consumption Expenditures (PCE) inflation data may impact next week's gold prices. The PCE price index next Friday could be the next key catalyst for gold prices.
The Fed cut interest rates by 50 basis points on Wednesday, initiating a loose monetary policy period, boosting the attractiveness of non-interest-bearing gold investments. Investors are also seeking hedge against uncertainties arising from long-standing conflicts in the Middle East and other regions.
Daniel Ghali, commodity strategist at TD Securities, stated that the Fed has just made a significant rate cut, initiating a loose period, so there is still some buying interest in the market.
Forex.com analyst Fawad Razaqzada's report suggests: "Geopolitical risks, such as ongoing conflicts in Gaza, Ukraine, and other places, will ensure the maintenance of safe-haven demand for gold."
In addition, with the continuous weakness of the US dollar, gold priced in US dollars appears cheaper to buyers using other currencies, providing additional impetus.
Next week, the US PCE inflation is coming.
On the US economic data front, next Monday, S&P Global will release the initial values of the Manufacturing and Services Purchasing Managers' Index (PMI) for September. Sengezer pointed out that if the Manufacturing PMI rebounds above 50 and the Services PMI remains stable above 50, investors may feel encouraged by the strong economic outlook. In this case, the dollar may remain resilient against its main competitors, leading to a downward correction in gold. On the other hand, PMI data lower than expected may have the opposite impact on the dollar.
Next Thursday, the Bureau of Economic Analysis (BEA) will release the final revised data for the Gross Domestic Product (GDP) for the second quarter, which is unlikely to trigger a market reaction. Next Friday, the BEA will release the Personal Consumption Expenditures (PCE) Price Index for August, which is a preferred inflation indicator for the Federal Reserve. Compared to earlier this year, investors have reduced concerns about inflation. Sengezer stated that nevertheless, an increase of 0.3% or higher in the month-over-month core PCE Price Index may boost the dollar. On the other hand, weak data could immediately put pressure on the dollar.
As the Federal Reserve's 'quiet period' is about to end, investors will also closely monitor policymakers' remarks. According to the CME Group's 'FedWatch' tool, the market expects a close to 70% likelihood that the Federal Reserve will cut policy rates by at least another 75 basis points in 2024.
Sengezer stated that if Federal Reserve officials suppress the likelihood of another significant rate cut this year, market positions suggest the dollar may rebound, dragging down gold prices. If policymakers consider another 50-basis-point rate cut at the upcoming meeting, the demand for the dollar may be hard to find.
Gold's technical outlook for next week
Sengezer pointed out that this week, on the daily chart,Relative Strength Index(RSIit rose to 70. The price of gold is still in the upper half of the upward channel since the end of June. The upper boundary of this channel at $2630 per ounce forms a key resistance.
Sengezer warned that the last time the daily chart RSI touched 70, the price of gold rose above the upper boundary of the upward channel was in mid-July, with a significant pullback at that time. Therefore, buyers may avoid another short-term surge and allow gold to correct lower after breaking $2630 per ounce and becoming overbought.
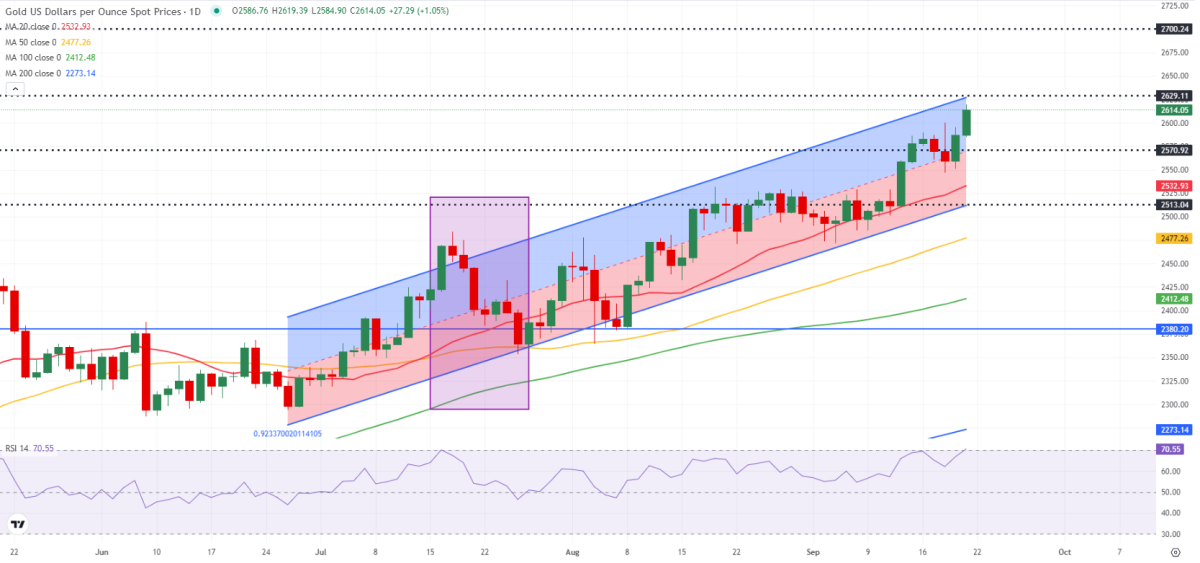
(Spot gold daily chart source: FXStreet)
In the downside, $2600 per ounce (integer level) forms a short-term support, next Resistanceat $2570 per ounce (midpoint of the rising channel) and $2530 per ounce (20-daySimple Moving Averageposition).
Sengezer finally pointed out that as the price of gold is already in an unknown range, it is difficult to set short-term upside targets. If investors overlook the overbought situation, $2700 per ounce could be seen as the next resistance.