
 受美元走软和中东紧张局势影响,现货黄金周四收盘大涨27.31美元,涨幅1.07%,报2586.49美元/盎司。
#黄金Technical analysis#24K99讯 In the Asian market on Friday (September 20), spot gold suddenly accelerated its short-term rise. The price of gold has just hit 2,593 US dollars/ounce. FXStreet chief analyst Valeria Bednarik wrote an article analyzing the technical prospects of gold.

(15 minute spot gold chart source: 24K99)
Bednarik pointed out that the price of gold has resumed its rise, with the goal of extending the increase above 2,600 US dollars/ounce.
 Affected by the weakening dollar and the tense situation in the Middle East, spot gold closed surging $27.31, or 1.07%, to $2586.49 per ounce on Thursday.
The US dollar index closed down 0.3% to close at 100.64 on Thursday, a sharp drop from an intraday high of 101.45. Traders worked hard to absorb the 50 basis point sharp interest rate cut announced by the Federal Reserve on Wednesday and switched to a relaxed monetary policy stance.
Alex Ebkarian, Chief Operating Officer of Allegiance Gold, said, “The market is considering larger and more interest rate cuts because our fiscal and trade deficits are, and this will further weaken the overall value of the dollar.”
Ebkarian added: “If you combine geopolitical risk with our current deficit, low yield environment, and weak dollar, the combination of all these factors will cause the price of gold to rise.”
Short-term technical prospects for gold
Bednarik said that gold prices are expected to retest recent highs and even continue to rise as investors sell dollars. The technical data on the daily chart supports this scenario becauseTechnical indicatorsSteady upward, well above the midline. Meanwhile, all moving averages are higher on the 20thsimple moving average(SMA) provides dynamic support near $2,527/oz.
Bednarik added that the outlook for gold is also bullish in the near future. On the 4-hour chart, technical indicators have extended their upward trend within positive levels, although the upward force is limited as the price of gold trades below the recent peak. Finally, the 100-period SMA and 200-period SMA gained upward traction at levels far below the current gold price, while the flat 20-period SMA attracted intraday buyers in the $2,570 per ounce area.
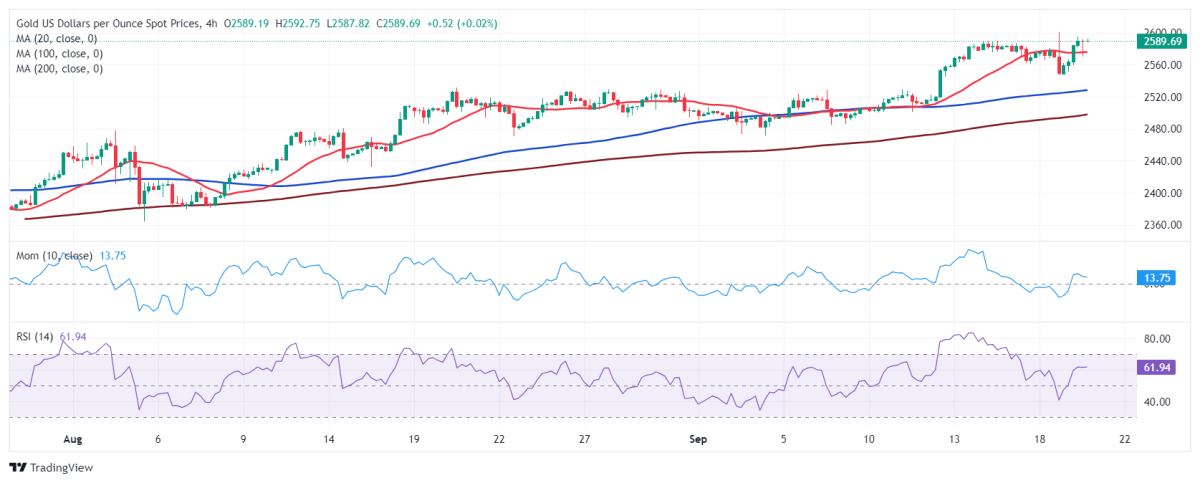
(Spot gold 4-hour chart source: FXStreet)
Bednarik gives the latest important withdrawal priceSupport leveland resistance levels:
Support levels: $2574.80/oz; $2561.65/oz; $2550.00/oz
Resistance levels: $2605.00/oz; $2620.00/oz; $2640.00/oz
At 11:03 Beijing time, spot gold was reported at 2593.06 US dollars/ounce.