
Most readers would already know that Textron's (NYSE:TXT) stock increased by 1.4% over the past three months. Given its impressive performance, we decided to study the company's key financial indicators as a company's long-term fundamentals usually dictate market outcomes. Particularly, we will be paying attention to Textron's ROE today.
Return on equity or ROE is a key measure used to assess how efficiently a company's management is utilizing the company's capital. In short, ROE shows the profit each dollar generates with respect to its shareholder investments.
How Do You Calculate Return On Equity?
The formula for ROE is:
 Return on Equity = Net Profit (from continuing operations) ÷ Shareholders' Equity
So, based on the above formula, the ROE for Textron is:
14% = US$929m ÷ US$6.9b (Based on the trailing twelve months to June 2024).
The 'return' is the profit over the last twelve months. So, this means that for every $1 of its shareholder's investments, the company generates a profit of $0.14.
What Is The Relationship Between ROE And Earnings Growth?
So far, we've learned that ROE is a measure of a company's profitability. Based on how much of its profits the company chooses to reinvest or "retain", we are then able to evaluate a company's future ability to generate profits. Generally speaking, other things being equal, firms with a high return on equity and profit retention, have a higher growth rate than firms that don't share these attributes.
Textron's Earnings Growth And 14% ROE
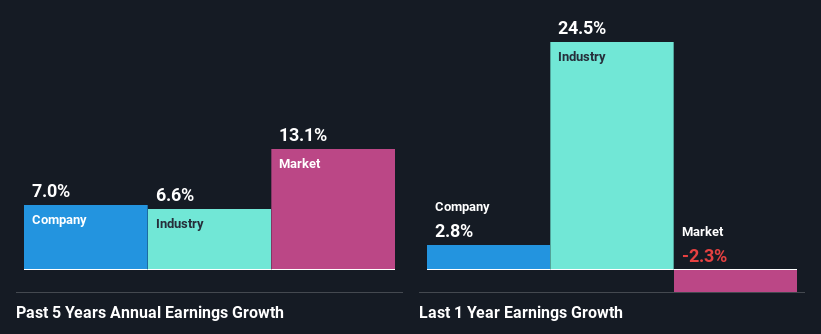
At first glance, Textron seems to have a decent ROE. Further, the company's ROE is similar to the industry average of 14%. This probably goes some way in explaining Textron's moderate 7.0% growth over the past five years amongst other factors.
As a next step, we compared Textron's net income growth with the industry and found that the company has a similar growth figure when compared with the industry average growth rate of 6.6% in the same period.
Earnings growth is a huge factor in stock valuation. The investor should try to establish if the expected growth or decline in earnings, whichever the case may be, is priced in. This then helps them determine if the stock is placed for a bright or bleak future. What is TXT worth today? The intrinsic value infographic in our free research report helps visualize whether TXT is currently mispriced by the market.
Is Textron Efficiently Re-investing Its Profits?
In Textron's case, its respectable earnings growth can probably be explained by its low three-year median payout ratio of 2.0% (or a retention ratio of 98%), which suggests that the company is investing most of its profits to grow its business.
Moreover, Textron is determined to keep sharing its profits with shareholders which we infer from its long history of paying a dividend for at least ten years. Based on the latest analysts' estimates, we found that the company's future payout ratio over the next three years is expected to hold steady at 1.6%. However, Textron's ROE is predicted to rise to 18% despite there being no anticipated change in its payout ratio.
Conclusion
Overall, we are quite pleased with Textron's performance. Specifically, we like that the company is reinvesting a huge chunk of its profits at a high rate of return. This of course has caused the company to see substantial growth in its earnings. On studying current analyst estimates, we found that analysts expect the company to continue its recent growth streak. Are these analysts expectations based on the broad expectations for the industry, or on the company's fundamentals? Click here to be taken to our analyst's forecasts page for the company.
Have feedback on this article? Concerned about the content? Get in touch with us directly. Alternatively, email editorial-team (at) simplywallst.com.
This article by Simply Wall St is general in nature. We provide commentary based on historical data and analyst forecasts only using an unbiased methodology and our articles are not intended to be financial advice. It does not constitute a recommendation to buy or sell any stock, and does not take account of your objectives, or your financial situation. We aim to bring you long-term focused analysis driven by fundamental data. Note that our analysis may not factor in the latest price-sensitive company announcements or qualitative material. Simply Wall St has no position in any stocks mentioned.
