
Howard Marks put it nicely when he said that, rather than worrying about share price volatility, 'The possibility of permanent loss is the risk I worry about... and every practical investor I know worries about.' So it might be obvious that you need to consider debt, when you think about how risky any given stock is, because too much debt can sink a company. Importantly, Afya Limited (NASDAQ:AFYA) does carry debt. But the more important question is: how much risk is that debt creating?
Why Does Debt Bring Risk?
Generally speaking, debt only becomes a real problem when a company can't easily pay it off, either by raising capital or with its own cash flow. In the worst case scenario, a company can go bankrupt if it cannot pay its creditors. However, a more usual (but still expensive) situation is where a company must dilute shareholders at a cheap share price simply to get debt under control. Having said that, the most common situation is where a company manages its debt reasonably well - and to its own advantage. When we examine debt levels, we first consider both cash and debt levels, together.
What Is Afya's Net Debt?
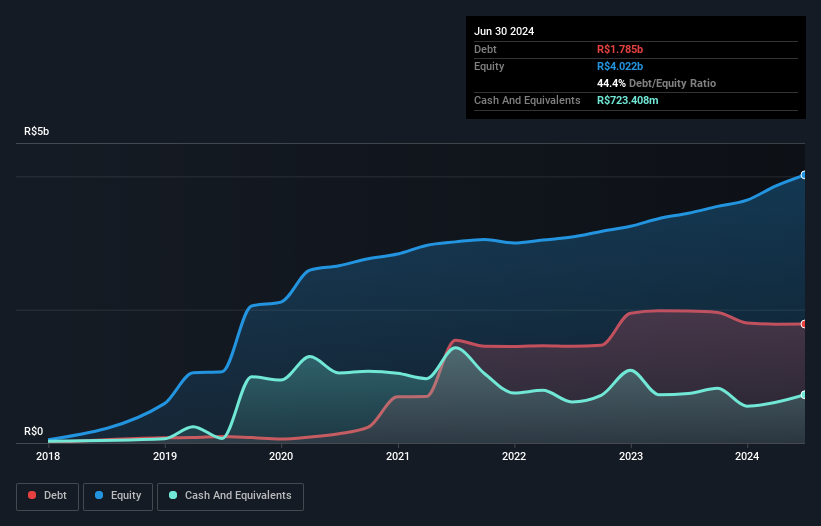
You can click the graphic below for the historical numbers, but it shows that Afya had R$1.78b of debt in June 2024, down from R$1.98b, one year before. However, it also had R$723.4m in cash, and so its net debt is R$1.06b.
A Look At Afya's Liabilities
 The latest balance sheet data shows that Afya had liabilities of R$974.4m due within a year, and liabilities of R$2.86b falling due after that. Offsetting these obligations, it had cash of R$723.4m as well as receivables valued at R$654.2m due within 12 months. So its liabilities total R$2.45b more than the combination of its cash and short-term receivables.
This deficit isn't so bad because Afya is worth R$8.17b, and thus could probably raise enough capital to shore up its balance sheet, if the need arose. However, it is still worthwhile taking a close look at its ability to pay off debt.
We use two main ratios to inform us about debt levels relative to earnings. The first is net debt divided by earnings before interest, tax, depreciation, and amortization (EBITDA), while the second is how many times its earnings before interest and tax (EBIT) covers its interest expense (or its interest cover, for short). This way, we consider both the absolute quantum of the debt, as well as the interest rates paid on it.
Looking at its net debt to EBITDA of 0.97 and interest cover of 3.8 times, it seems to us that Afya is probably using debt in a pretty reasonable way. So we'd recommend keeping a close eye on the impact financing costs are having on the business. Also relevant is that Afya has grown its EBIT by a very respectable 28% in the last year, thus enhancing its ability to pay down debt. There's no doubt that we learn most about debt from the balance sheet. But ultimately the future profitability of the business will decide if Afya can strengthen its balance sheet over time. So if you're focused on the future you can check out this free report showing analyst profit forecasts.
But our final consideration is also important, because a company cannot pay debt with paper profits; it needs cold hard cash. So we always check how much of that EBIT is translated into free cash flow. Over the last three years, Afya recorded free cash flow worth a fulsome 91% of its EBIT, which is stronger than we'd usually expect. That puts it in a very strong position to pay down debt.
Our View
The good news is that Afya's demonstrated ability to convert EBIT to free cash flow delights us like a fluffy puppy does a toddler. But truth be told we feel its interest cover does undermine this impression a bit. Zooming out, Afya seems to use debt quite reasonably; and that gets the nod from us. While debt does bring risk, when used wisely it can also bring a higher return on equity. Above most other metrics, we think its important to track how fast earnings per share is growing, if at all. If you've also come to that realization, you're in luck, because today you can view this interactive graph of Afya's earnings per share history for free.
At the end of the day, it's often better to focus on companies that are free from net debt. You can access our special list of such companies (all with a track record of profit growth). It's free.
Have feedback on this article? Concerned about the content? Get in touch with us directly. Alternatively, email editorial-team (at) simplywallst.com.
This article by Simply Wall St is general in nature. We provide commentary based on historical data and analyst forecasts only using an unbiased methodology and our articles are not intended to be financial advice. It does not constitute a recommendation to buy or sell any stock, and does not take account of your objectives, or your financial situation. We aim to bring you long-term focused analysis driven by fundamental data. Note that our analysis may not factor in the latest price-sensitive company announcements or qualitative material. Simply Wall St has no position in any stocks mentioned.
