
With its stock down 1.3% over the past week, it is easy to disregard Becton Dickinson (NYSE:BDX). But if you pay close attention, you might find that its key financial indicators look quite decent, which could mean that the stock could potentially rise in the long-term given how markets usually reward more resilient long-term fundamentals. Specifically, we decided to study Becton Dickinson's ROE in this article.
Return on Equity or ROE is a test of how effectively a company is growing its value and managing investors' money. Simply put, it is used to assess the profitability of a company in relation to its equity capital.
How To Calculate Return On Equity?
The formula for ROE is:
Return on Equity = Net Profit (from continuing operations) ÷ Shareholders' Equity
So, based on the above formula, the ROE for Becton Dickinson is:
5.6% = US$1.5b ÷ US$26b (Based on the trailing twelve months to June 2024).
The 'return' is the amount earned after tax over the last twelve months. So, this means that for every $1 of its shareholder's investments, the company generates a profit of $0.06.
What Is The Relationship Between ROE And Earnings Growth?
We have already established that ROE serves as an efficient profit-generating gauge for a company's future earnings. Based on how much of its profits the company chooses to reinvest or "retain", we are then able to evaluate a company's future ability to generate profits. Generally speaking, other things being equal, firms with a high return on equity and profit retention, have a higher growth rate than firms that don't share these attributes.
Becton Dickinson's Earnings Growth And 5.6% ROE
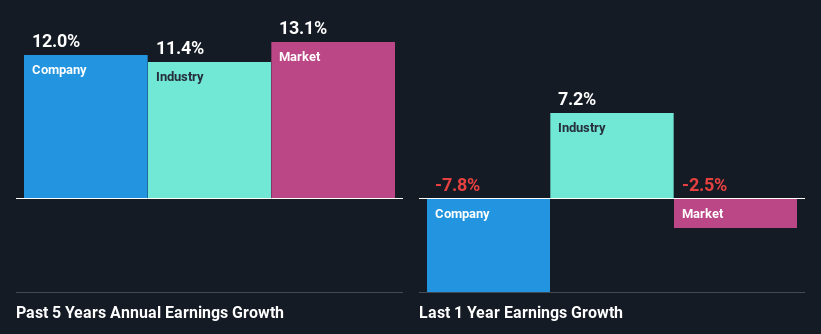
On the face of it, Becton Dickinson's ROE is not much to talk about. We then compared the company's ROE to the broader industry and were disappointed to see that the ROE is lower than the industry average of 11%. Becton Dickinson was still able to see a decent net income growth of 12% over the past five years. So, the growth in the company's earnings could probably have been caused by other variables. For instance, the company has a low payout ratio or is being managed efficiently.
Next, on comparing Becton Dickinson's net income growth with the industry, we found that the company's reported growth is similar to the industry average growth rate of 11% over the last few years.
Earnings growth is an important metric to consider when valuing a stock. The investor should try to establish if the expected growth or decline in earnings, whichever the case may be, is priced in. This then helps them determine if the stock is placed for a bright or bleak future. One good indicator of expected earnings growth is the P/E ratio which determines the price the market is willing to pay for a stock based on its earnings prospects. So, you may want to check if Becton Dickinson is trading on a high P/E or a low P/E, relative to its industry.
Is Becton Dickinson Making Efficient Use Of Its Profits?
The high three-year median payout ratio of 68% (or a retention ratio of 32%) for Becton Dickinson suggests that the company's growth wasn't really hampered despite it returning most of its income to its shareholders.
Moreover, Becton Dickinson is determined to keep sharing its profits with shareholders which we infer from its long history of paying a dividend for at least ten years. Upon studying the latest analysts' consensus data, we found that the company's future payout ratio is expected to drop to 27% over the next three years. The fact that the company's ROE is expected to rise to 16% over the same period is explained by the drop in the payout ratio.
Conclusion
On the whole, we do feel that Becton Dickinson has some positive attributes. That is, quite an impressive growth in earnings. However, the low profit retention means that the company's earnings growth could have been higher, had it been reinvesting a higher portion of its profits. That being so, the latest analyst forecasts show that the company will continue to see an expansion in its earnings. To know more about the latest analysts predictions for the company, check out this visualization of analyst forecasts for the company.
Have feedback on this article? Concerned about the content? Get in touch with us directly. Alternatively, email editorial-team (at) simplywallst.com.
This article by Simply Wall St is general in nature. We provide commentary based on historical data and analyst forecasts only using an unbiased methodology and our articles are not intended to be financial advice. It does not constitute a recommendation to buy or sell any stock, and does not take account of your objectives, or your financial situation. We aim to bring you long-term focused analysis driven by fundamental data. Note that our analysis may not factor in the latest price-sensitive company announcements or qualitative material. Simply Wall St has no position in any stocks mentioned.