
By buying an index fund, you can roughly match the market return with ease. But if you pick the right individual stocks, you could make more than that. For example, W. R. Berkley Corporation (NYSE:WRB) shareholders have seen the share price rise 83% over three years, well in excess of the market return (15%, not including dividends). However, more recent returns haven't been as impressive as that, with the stock returning just 38% in the last year, including dividends.
Now it's worth having a look at the company's fundamentals too, because that will help us determine if the long term shareholder return has matched the performance of the underlying business.
While the efficient markets hypothesis continues to be taught by some, it has been proven that markets are over-reactive dynamic systems, and investors are not always rational. One imperfect but simple way to consider how the market perception of a company has shifted is to compare the change in the earnings per share (EPS) with the share price movement.
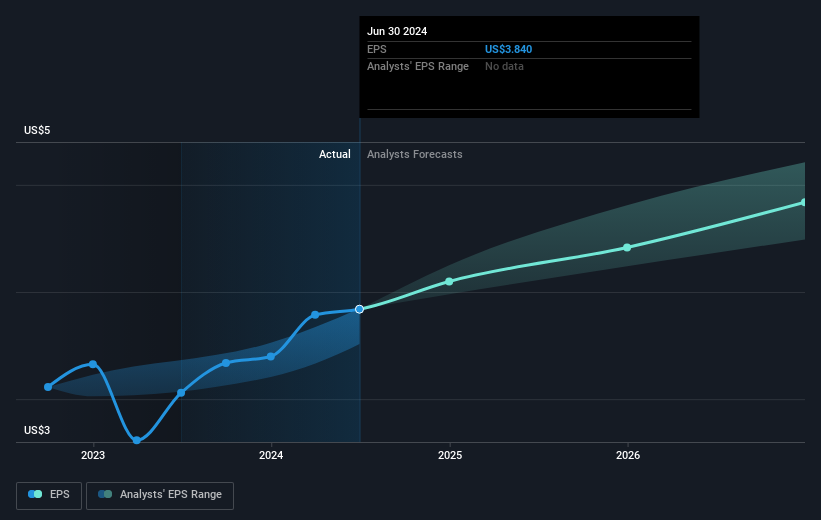
W. R. Berkley was able to grow its EPS at 22% per year over three years, sending the share price higher. This EPS growth is remarkably close to the 22% average annual increase in the share price. This observation indicates that the market's attitude to the business hasn't changed all that much. Rather, the share price has approximately tracked EPS growth.
You can see how EPS has changed over time in the image below (click on the chart to see the exact values).
We know that W. R. Berkley has improved its bottom line lately, but is it going to grow revenue? You could check out this free report showing analyst revenue forecasts.
What About Dividends?
When looking at investment returns, it is important to consider the difference between total shareholder return (TSR) and share price return. The TSR incorporates the value of any spin-offs or discounted capital raisings, along with any dividends, based on the assumption that the dividends are reinvested. So for companies that pay a generous dividend, the TSR is often a lot higher than the share price return. We note that for W. R. Berkley the TSR over the last 3 years was 96%, which is better than the share price return mentioned above. The dividends paid by the company have thusly boosted the total shareholder return.
A Different Perspective
It's nice to see that W. R. Berkley shareholders have received a total shareholder return of 38% over the last year. Of course, that includes the dividend. That gain is better than the annual TSR over five years, which is 15%. Therefore it seems like sentiment around the company has been positive lately. Someone with an optimistic perspective could view the recent improvement in TSR as indicating that the business itself is getting better with time. Is W. R. Berkley cheap compared to other companies? These 3 valuation measures might help you decide.
Of course W. R. Berkley may not be the best stock to buy. So you may wish to see this free collection of growth stocks.
Please note, the market returns quoted in this article reflect the market weighted average returns of stocks that currently trade on American exchanges.
Have feedback on this article? Concerned about the content? Get in touch with us directly. Alternatively, email editorial-team (at) simplywallst.com.
This article by Simply Wall St is general in nature. We provide commentary based on historical data and analyst forecasts only using an unbiased methodology and our articles are not intended to be financial advice. It does not constitute a recommendation to buy or sell any stock, and does not take account of your objectives, or your financial situation. We aim to bring you long-term focused analysis driven by fundamental data. Note that our analysis may not factor in the latest price-sensitive company announcements or qualitative material. Simply Wall St has no position in any stocks mentioned.