
 受美联储在即将召开的政策会议上大幅降息的预期不断增强的提振,黄金价格在上周下半周飙升,创下2580美元/盎司上方的历史新高。
#GoldTechnical Analysis#24K99 News Monday (September 16th) Asian market morning, spot gold maintained a strong trend after a sharp rise last Friday, and the price is currently above $2581 per ounce. Nicholas Kitonyi, a well-known financial website FXDailyReport analyst, wrote an article analyzing the future trend of gold.
Kitonyi said that last Friday, the price of gold continued to rise to around $2581 per ounce. In the 60-minute chart, the price of gold continued to trade within the upward channel.
Kitonyi added that the price of gold has now risen above the 100-hour moving average. Therefore, the price of gold is in the 14-hourRelative Strength Index(RSIto trade at overbought levels.
 Boosted by the increasing expectation of a significant rate cut at the upcoming policy meeting by the Federal Reserve, the price of gold soared in the second half of last week, reaching a historic high above $2580 per ounce.
The spot price of gold closed significantly higher at $2578.68 per ounce last Friday, with a gain of $20.10 or 0.78%. The gold price surged by $47.30 at the close on Thursday.
Nick Timiraos, a journalist from The Wall Street Journal, known as the "Fed Whisperer," wrote in an article last Thursday that it is almost certain that the Federal Reserve will cut interest rates at this week's meeting. However, the decision on the magnitude of the rate cut is still uncertain.
After the publication of the article, according to CME's "FedWatch" tool, the probability of a 50 basis point rate cut at the September meeting increased from nearly 20% in the early morning of last Thursday to over 40%.
The spot price of gold skyrocketed by $81.43 or 3.26% last week, with the highest price reaching $2586.09 per ounce during Friday's trading session, setting a new record high.
Two pictures of the technical prospects of gold
In terms of short-term trends, Kitonyi states that from technical aspectsTake a look, according to the 60-minute trend chart of gold, the gold price is trading within an upward channel. After entering overbought territory, the 14-hour relative strength index (RSI) also supports a bullish bias.
Therefore, the gold bulls will seek for the gold price to continue its current upward trend and rise towards $2610 per ounce, or even higher to $2641 per ounce.
On the other hand, the gold bears will seek to take profits when the gold price falls to around $2548 per ounce or even lower to $2518 per ounce.
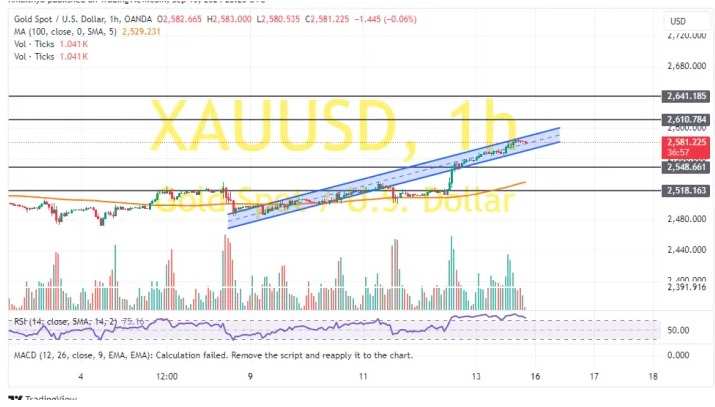
(Spot gold 60-minute chart source: FXDailyReport)
Kitonyi pointed out that on the daily chart, gold is still trading within an upward channel. The 14-day RSI also supports a bullish bias as it is on the verge of entering overbought territory.
Therefore, the gold bulls will set their long-term profit target at around $2660 per ounce or even higher at $2735 per ounce.
On the other hand, the bears will seek to profit from the settlement when the gold price falls to around $2494 per ounce or even lower at $2419 per ounce.
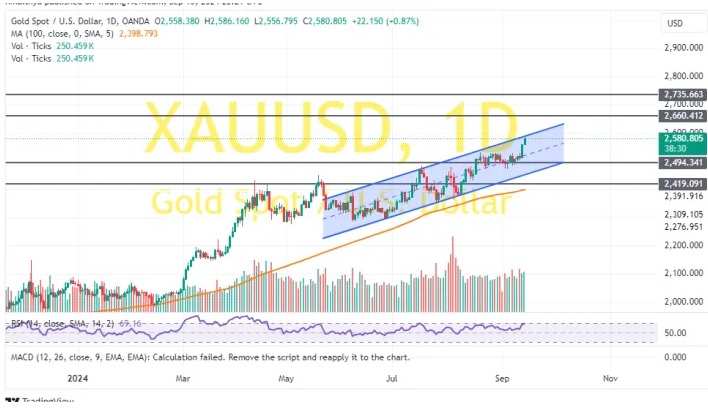
(Spot gold daily chart source: FXDailyReport)
At 08:13 Beijing time, spot gold was reported at $2581.26 per ounce.
