
If we want to find a stock that could multiply over the long term, what are the underlying trends we should look for? Firstly, we'll want to see a proven return on capital employed (ROCE) that is increasing, and secondly, an expanding base of capital employed. This shows us that it's a compounding machine, able to continually reinvest its earnings back into the business and generate higher returns. So on that note, Chart Industries (NYSE:GTLS) looks quite promising in regards to its trends of return on capital.
Understanding Return On Capital Employed (ROCE)
If you haven't worked with ROCE before, it measures the 'return' (pre-tax profit) a company generates from capital employed in its business. To calculate this metric for Chart Industries, this is the formula:
Return on Capital Employed = Earnings Before Interest and Tax (EBIT) ÷ (Total Assets - Current Liabilities)
0.08 = US$586m ÷ (US$9.3b - US$1.9b) (Based on the trailing twelve months to June 2024).
Thus, Chart Industries has an ROCE of 8.0%. In absolute terms, that's a low return and it also under-performs the Machinery industry average of 13%.
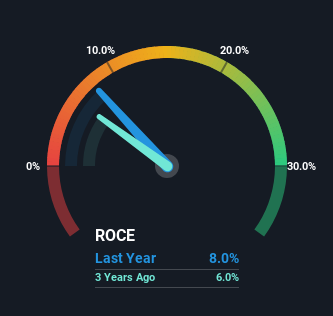
In the above chart we have measured Chart Industries' prior ROCE against its prior performance, but the future is arguably more important. If you'd like, you can check out the forecasts from the analysts covering Chart Industries for free.
What Does the ROCE Trend For Chart Industries Tell Us?
Even though ROCE is still low in absolute terms, it's good to see it's heading in the right direction. Over the last five years, returns on capital employed have risen substantially to 8.0%. The amount of capital employed has increased too, by 351%. The increasing returns on a growing amount of capital is common amongst multi-baggers and that's why we're impressed.
The Bottom Line
To sum it up, Chart Industries has proven it can reinvest in the business and generate higher returns on that capital employed, which is terrific. And investors seem to expect more of this going forward, since the stock has rewarded shareholders with a 70% return over the last five years. With that being said, we still think the promising fundamentals mean the company deserves some further due diligence.
One more thing: We've identified 2 warning signs with Chart Industries (at least 1 which is significant) , and understanding them would certainly be useful.
If you want to search for solid companies with great earnings, check out this free list of companies with good balance sheets and impressive returns on equity.
Have feedback on this article? Concerned about the content? Get in touch with us directly. Alternatively, email editorial-team (at) simplywallst.com.
This article by Simply Wall St is general in nature. We provide commentary based on historical data and analyst forecasts only using an unbiased methodology and our articles are not intended to be financial advice. It does not constitute a recommendation to buy or sell any stock, and does not take account of your objectives, or your financial situation. We aim to bring you long-term focused analysis driven by fundamental data. Note that our analysis may not factor in the latest price-sensitive company announcements or qualitative material. Simply Wall St has no position in any stocks mentioned.