
Analysts say that investors tend to be overly optimistic when the market is booming and overly pessimistic when the market is declining. This is why sentiment readings are considered to be contrarian indicators.
After experiencing volatility for the second consecutive month, the US stock market has rebounded, mainly due to the rebound of some large technology stocks and the decline in US bond yields.
$S&P 500 Index (.SPX.US)$In the past four trading days, it has risen by 3.46%, among which $NVIDIA (NVDA.US)$Soaring by 15.9% during the same period, this puts the S&P 500 just 1.3% away from its record high in mid-July.
Market observers and data analysts at Bespoke Investment believe that all of this indicates the benefits of investors remaining cautious of reverse market signals. They pointed out in a new report that, at a time when bullish sentiment has declined, the US stock market has experienced the latest round of rebound.
Bespoke Investment analyzed the latest report from the American Association of Individual Investors (AAII). The AAII is a weekly sentiment survey, which is considered more valuable because it has been running for over 35 years.
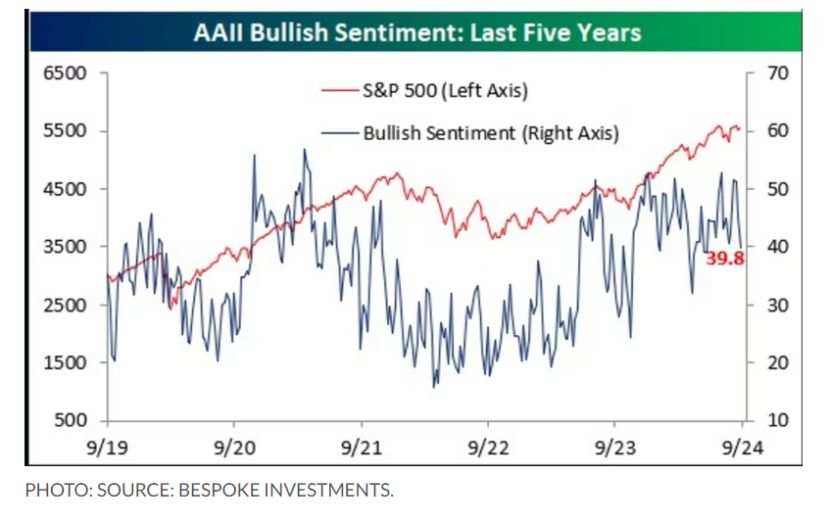
Bespoke Investment noted that after exceeding 50% in recent weeks, the AAII bullish sentiment index sharply dropped to 39.8% this week as respondents became more cautious.
Next, they looked at the 52-week rolling average of the AAII bullish sentiment and stated: "This provides a smoother, longer-term perspective on sentiment readings."
The second chart shows that from the end of 2022 to the beginning of 2023, individual investors' sentiment was at its most bearish, which happened to be when the brutal bear market was about to turn into the current bull market.
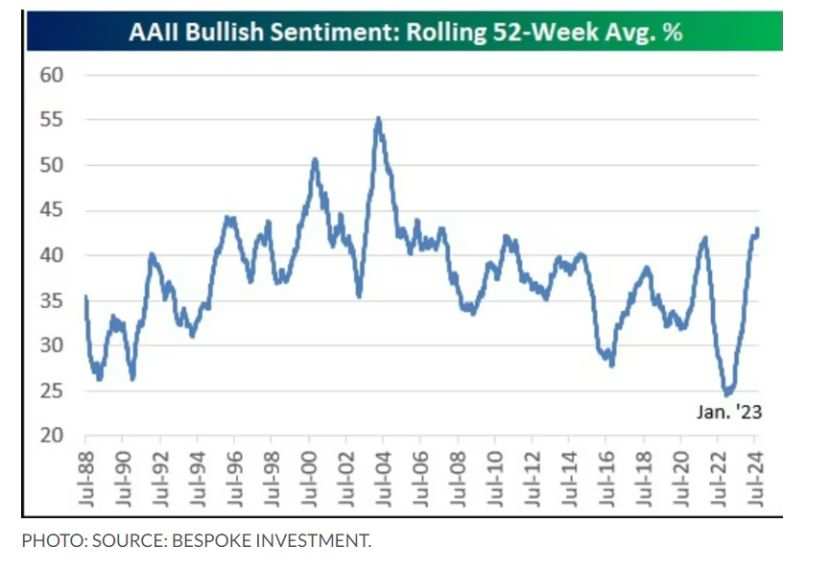
Bespoke Investment said, "In hindsight, the most pessimistic period is actually the best time for investors to be bullish. Considering how well the market has performed since then, this is why sentiment readings are considered contrarian indicators, with investors often being overly optimistic when the market is booming and overly pessimistic when it is falling."
Furthermore, the chart below shows the monthly average historical difference between AAII bullish and bearish sentiment readings, with higher readings indicating that investors have been more optimistic over the years, while lower readings indicate less optimism among investors.
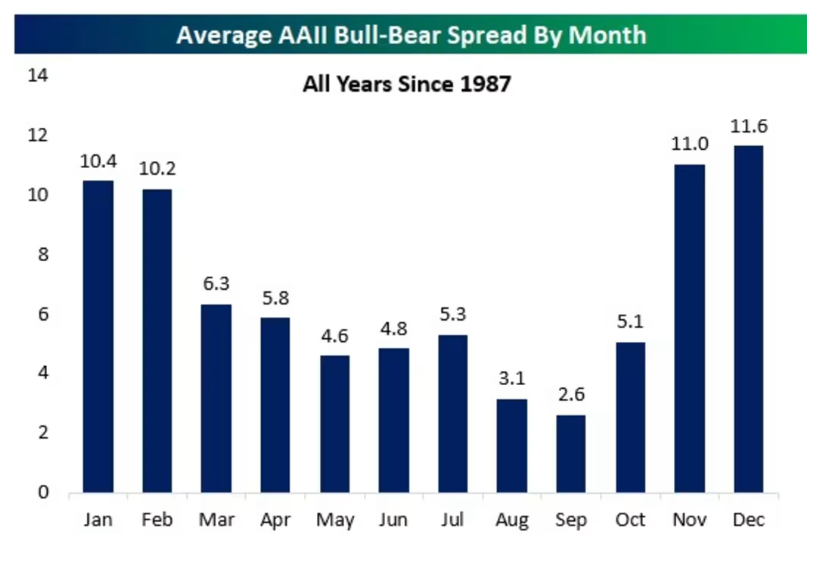
As we can see, September has historically had the smallest difference. Bespoke Investment said:"Given that September has consistently been the worst-performing month for US stocks, this is not surprising, but it once again highlights the contrarian nature of investor sentiment."
However, despite September being a bad month, it is followed by the strongest period in history - the fourth quarter.
Bespoke Investment concluded:"Considering the continuous rise of US stocks over time, the weakness in September should be seen as an attractive opportunity to increase equity exposure rather than becoming more pessimistic."
Editor/ping