
#Gold Technical Analysis# 24K99 News On Friday (September 13th), in the early European session, spot gold maintained a rebound trend and is currently trading near $2568 per ounce. FXStreet senior analyst Dhwani Mehta wrote an article on Friday analyzing the technical trend of gold prices.
Spot gold soared $47.30 and rose 1.88% to close at $2558.58 per ounce on Thursday. Influenced by the strong speculation of a large rate cut by the Federal Reserve, the gold price further increased to $2571.18 per ounce in the early European session on Friday, hitting a new historical high.
Mehta stated that before the release of the US consumer confidence data on Friday, the gold price continued to break through the resistance on Thursday. As the market once again speculated on a large rate cut by the Federal Reserve, the US dollar and US Treasury yields dropped.
Mehta said that due to the bullish Relative Strength Index (RSI), gold may have more room for an upward trend. The gold price is expected to reach $2600 per ounce.
Nick Timiraos, a reporter from The Wall Street Journal known as the "Fed Whisperer", wrote in his latest article that the Federal Reserve is expected to cut rates at its meeting next week, which is almost certain. However, the magnitude of the rate cut remains uncertain. After Timiraos published the article, the percentage of traders speculating a 50 basis point rate cut by the Federal Reserve on September 18th increased from about 28% before the article was published to 41%.
IG analyst Tony Sycamore said, "This is another turning point in the debate over the Federal Reserve interest rate cuts. Everyone thought we were back on track for a 25 basis point cut, but suddenly we are back to 50 basis points."
Mehta stated that gold traders are now waiting for the preliminary consumer confidence index from the University of Michigan in September, as well as inflation expectations data, to obtain new trading signals. In addition, weekend fund flows may also play a key role in the gold price trend.
The preliminary consumer confidence index from the University of Michigan for September will be released at 22:00 Beijing time on Friday. It is expected to be 68.5, while the final value for August was 67.9.
Investors will also focus on inflation-related data. The initial estimate for September's 1-year inflation expectations at the University of Michigan in the United States is 3.0%, with a previous value of 3.0%. The initial estimate for September's 5-10 year inflation expectations at the University of Michigan in the United States is 2.7%, with a previous value of 2.8%.
How to trade gold?
Mehta pointed out that from the daily chart, it can be seen that the price of gold broke through the upper boundary of the three-week trading range at the closing on Thursday, which was the previous historical high of $2532 per ounce.
At the same time, the 21-day Simple Moving Average (SMA) continues to provide strong support for gold buyers. The current position of this average is $2513 per ounce.
Mehta said that as the range breakout plays out, the price of gold has finally reached the target of the symmetrical triangle that lasted for one and a half months, which is $2560 per ounce.
Despite the ongoing increase, the 14-day Relative Strength Index (RSI) is still in the bullish zone, with more upside potential before breaking the overbought boundary. The RSI is currently trading around 66.50.
Mehta said that if the upward momentum of the gold price continues, the next resistance level is expected to be at $2600 per ounce. Once this level is broken, the price of gold will test the psychological level of $2650 per ounce.
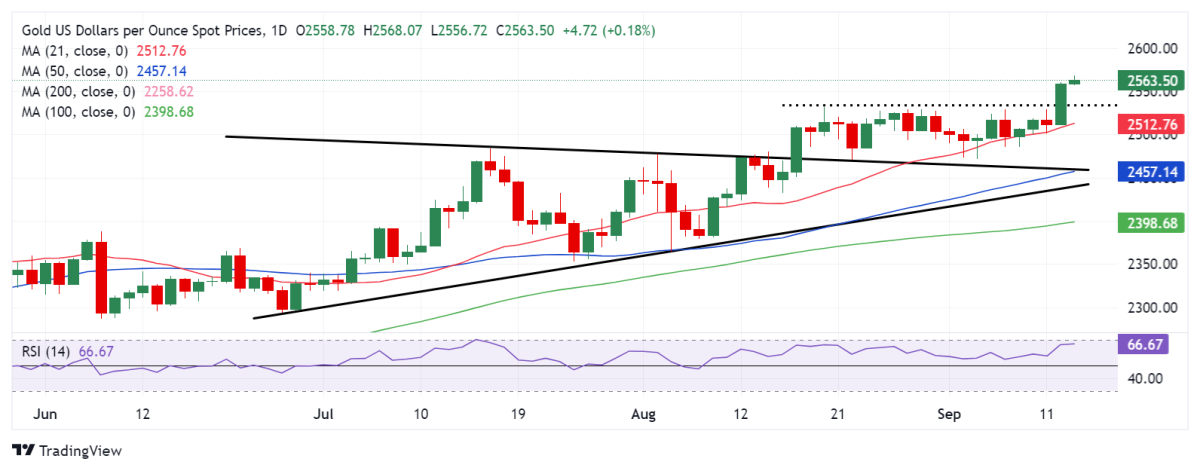
(Spot gold daily chart source: FXStreet)
On the other hand, Mehta added that if the gold price subsequently corrects, the first resistance level will be at the previous historical high of $2532 per ounce. If it falls below this level, then the 21-day moving average of $2513 per ounce will be tested. The gold price needs to consistently fall below the latter in order to challenge the key resistance level of $2500 per ounce.
At 16:19 Beijing time, spot gold was reported at $2568.21 per ounce.