
#黄金技术分析 #24K99讯 In the Asian market on Friday (September 13), spot gold continued to rise after yesterday's sharp rise. Currently, the price of gold is trading around 2,565 US dollars/ounce; the price of gold soared to 2568.03 US dollars/ounce earlier, setting a new record high. FXStreet chief analyst Valeria Bednarik wrote an article analyzing the technical prospects of gold.
Bednarik pointed out that after the ECB announced monetary policy and the US released relevant macroeconomic data on Thursday, the spot gold price soared to a record high and is currently maintaining a bullish trend.
Spot gold closed at $47.30, or 1.88%, to close at $2558.58 per ounce on Thursday.
The ECB cut interest rates on Thursday, but Central Bank President Lagarde downplayed expectations that interest rates will be cut again next month, saying that the central bank will decide the next policy action based on economic data. EUR/USD rose on Thursday, which hurt the US dollar index.
According to data released by the US Department of Labor on Thursday, the number of initial jobless claims for the week ending September 7 was 0.23 million, an increase of 2,000 over the previous reporting period, which is higher than the market's forecast of 0.225 million.
Another data on Thursday showed that the US producer price index (PPI) rose 1.7% year on year in August, lower than the 1.8% forecast; while the core PPI rose 2.4% year on year, which is also lower than the 2.5% forecast.
Ole Hansen, head of commodity strategy at Saxo Bank, said, “A series of factors such as the ECB's interest rate cut, a slight increase in initial jobless claims, and PPI are enough to push the price of gold to a record high.”
Short-term technical prospects for gold
Bednarik said that from a technical perspective, gold has maintained a bullish trend. The daily chart shows that for the sixth consecutive trading day, the price of gold met buyers near the bullish 20-day EMA, while the 100-day EMA and 200-day EMA continued to rise, far below the 20-day EMA. Meanwhile, technical indicators have resumed their bullish momentum, and there is plenty of room to expand gains.
Bednarik added that judging from the 4-hour trend chart, the risk of the gold price trend tends to rise. The 20-period SMA rebounded above the flat 100-period SMA, below the current gold price level of more than $30; while the 200-period SMA moved upward, far below the other two moving averages. Finally, technical indicators have maintained a sharp upward trend, and the Relative Strength Index (RSI) is close to being overbought. However, there is no sign that the bullish momentum has dried up, and buyers may buy in the event of a pullback and aim for higher highs.
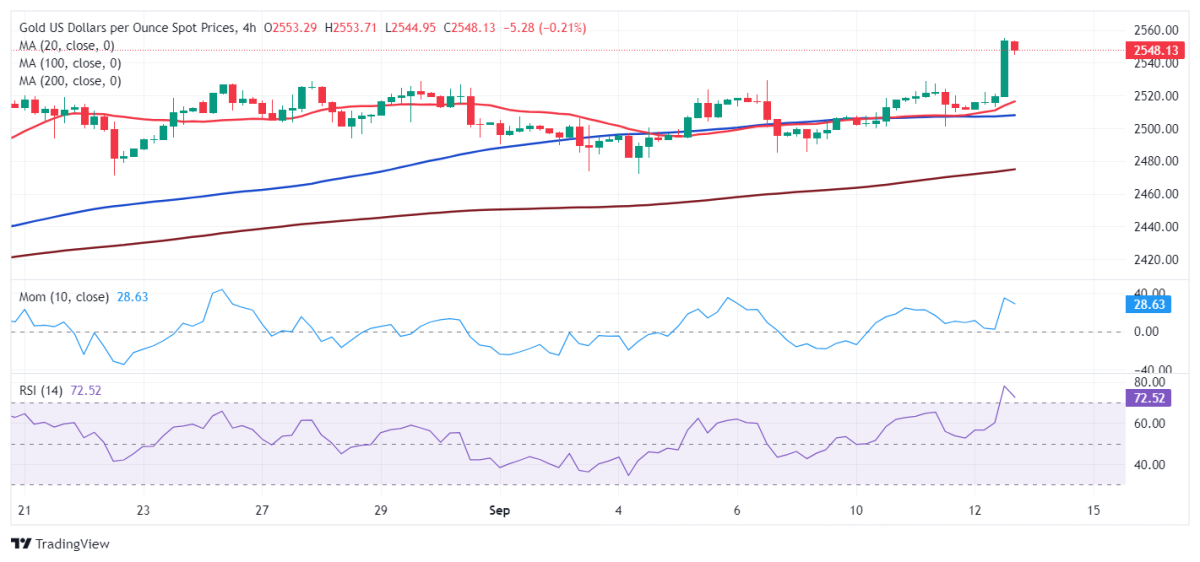
(Spot gold 4-hour chart source: FXStreet)
Bednarik gave the latest important support and resistance levels for gold prices:
Support levels: $2535.10 per ounce; $2521.85 per ounce; $2507.20 per ounce
Resistance levels: $2570.00/oz; $2585.00/oz
At 10:17 Beijing time, spot gold was reported at 2564.73 US dollars/ounce.