
Howard Marks put it nicely when he said that, rather than worrying about share price volatility, 'The possibility of permanent loss is the risk I worry about... and every practical investor I know worries about.' It's only natural to consider a company's balance sheet when you examine how risky it is, since debt is often involved when a business collapses. We can see that ICON Public Limited Company (NASDAQ:ICLR) does use debt in its business. But the real question is whether this debt is making the company risky.
When Is Debt A Problem?
Debt is a tool to help businesses grow, but if a business is incapable of paying off its lenders, then it exists at their mercy. Ultimately, if the company can't fulfill its legal obligations to repay debt, shareholders could walk away with nothing. However, a more frequent (but still costly) occurrence is where a company must issue shares at bargain-basement prices, permanently diluting shareholders, just to shore up its balance sheet. Of course, plenty of companies use debt to fund growth, without any negative consequences. When we examine debt levels, we first consider both cash and debt levels, together.
What Is ICON's Debt?
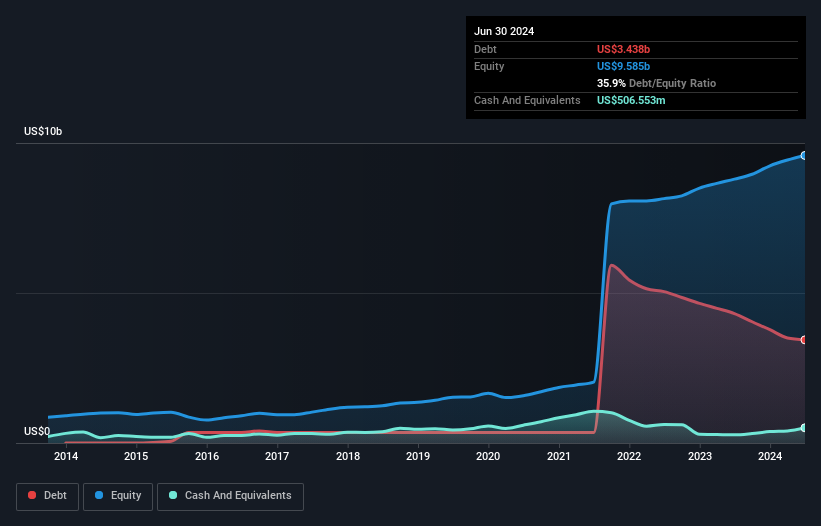
The image below, which you can click on for greater detail, shows that ICON had debt of US$3.44b at the end of June 2024, a reduction from US$4.31b over a year. On the flip side, it has US$506.6m in cash leading to net debt of about US$2.93b.
How Healthy Is ICON's Balance Sheet?
 We can see from the most recent balance sheet that ICON had liabilities of US$2.74b falling due within a year, and liabilities of US$4.64b due beyond that. Offsetting these obligations, it had cash of US$506.6m as well as receivables valued at US$2.96b due within 12 months. So its liabilities total US$3.92b more than the combination of its cash and short-term receivables.
Since publicly traded ICON shares are worth a very impressive total of US$24.0b, it seems unlikely that this level of liabilities would be a major threat. Having said that, it's clear that we should continue to monitor its balance sheet, lest it change for the worse.
In order to size up a company's debt relative to its earnings, we calculate its net debt divided by its earnings before interest, tax, depreciation, and amortization (EBITDA) and its earnings before interest and tax (EBIT) divided by its interest expense (its interest cover). This way, we consider both the absolute quantum of the debt, as well as the interest rates paid on it.
ICON has net debt worth 1.7 times EBITDA, which isn't too much, but its interest cover looks a bit on the low side, with EBIT at only 3.9 times the interest expense. While these numbers do not alarm us, it's worth noting that the cost of the company's debt is having a real impact. If ICON can keep growing EBIT at last year's rate of 16% over the last year, then it will find its debt load easier to manage. When analysing debt levels, the balance sheet is the obvious place to start. But ultimately the future profitability of the business will decide if ICON can strengthen its balance sheet over time. So if you're focused on the future you can check out this free report showing analyst profit forecasts.
Finally, a business needs free cash flow to pay off debt; accounting profits just don't cut it. So it's worth checking how much of that EBIT is backed by free cash flow. Over the last three years, ICON recorded free cash flow worth a fulsome 88% of its EBIT, which is stronger than we'd usually expect. That puts it in a very strong position to pay down debt.
Our View
Happily, ICON's impressive conversion of EBIT to free cash flow implies it has the upper hand on its debt. But truth be told we feel its interest cover does undermine this impression a bit. When we consider the range of factors above, it looks like ICON is pretty sensible with its use of debt. That means they are taking on a bit more risk, in the hope of boosting shareholder returns. Above most other metrics, we think its important to track how fast earnings per share is growing, if at all. If you've also come to that realization, you're in luck, because today you can view this interactive graph of ICON's earnings per share history for free.
When all is said and done, sometimes its easier to focus on companies that don't even need debt. Readers can access a list of growth stocks with zero net debt 100% free, right now.
Have feedback on this article? Concerned about the content? Get in touch with us directly. Alternatively, email editorial-team (at) simplywallst.com.
This article by Simply Wall St is general in nature. We provide commentary based on historical data and analyst forecasts only using an unbiased methodology and our articles are not intended to be financial advice. It does not constitute a recommendation to buy or sell any stock, and does not take account of your objectives, or your financial situation. We aim to bring you long-term focused analysis driven by fundamental data. Note that our analysis may not factor in the latest price-sensitive company announcements or qualitative material. Simply Wall St has no position in any stocks mentioned.
