
#黄金技术分析 #24K99讯 In the Asian market on Thursday (September 12), spot gold rebounded after falling back overnight in New York. Currently, the price of gold is trading around 2,513 US dollars/ounce. FXStreet chief analyst Valeria Bednarik wrote an article analyzing the technical prospects of gold.
Bednarik pointed out that the price of gold peaked at $2528.95 per ounce on Wednesday. After the US CPI data was released, the price of gold changed and at one point fell to the level of 2,500 US dollars/ounce. However, the price of gold met buyers around 2,500 US dollars/ounce.
The US Bureau of Labor Statistics reported on Wednesday that the US consumer price index (CPI) rose 0.2% month-on-month in August, in line with market expectations. However, it is worth noting that the US core CPI rose 0.3% month-on-month in August, the biggest increase in 4 months. The increase was higher than expected of 0.2%. Economists believe that the core inflation rate reflects potential inflation better than the overall CPI.
Neil Birrell, chief investment officer of Premier Miton Investors, commented on the US CPI report and said that the possibility that the Federal Reserve will cut interest rates by 50 basis points next week has been hit hard by this figure.
Spot gold once plummeted to 2,500.74 US dollars/ounce after the US CPI data was released, down nearly $30 from the daily high. The price of gold then rebounded from its low point. Spot gold finally closed down 0.2% on Wednesday to $2511.28 per ounce.
Bednarik wrote that as the price of gold breaks through $2,510/oz again, the goal is to retest the record high in the $2,530/oz region.
(Screenshot source: FXStreet)
Bednarik said the next important event will be the ECB's monetary policy decision on Thursday. The market generally expects that officials will cut each of the three major interest rates by 25 basis points. ECB President Christine Lagarde (Christine Lagarde)'s change in the usual wording could cause fluctuations in the entire financial market.
Short-term technical prospects for gold
Bednarik said that from a technical perspective, the daily gold chart shows that despite the lack of upward momentum, the price of gold is still bullish. The price of gold continued to trade above the bullish 20-day simple moving average and found buyers near it. Meanwhile, the 100-day SMA and 200-day SMA maintained a bullish trend far below the current price of gold. Finally, technical indicators remain at a positive level, lacking clear directional strength, but risks are still biased towards the upside.
Bednarik added that in the short term, according to the 4-hour chart, gold is in a neutral to bullish position. The price of gold is trading above the 20-period SMA and the 100-period SMA, which tend to converge. These two moving averages are around $2507.00 per ounce. Technical indicators rebounded near the midline, maintaining an upward trend within positive levels.
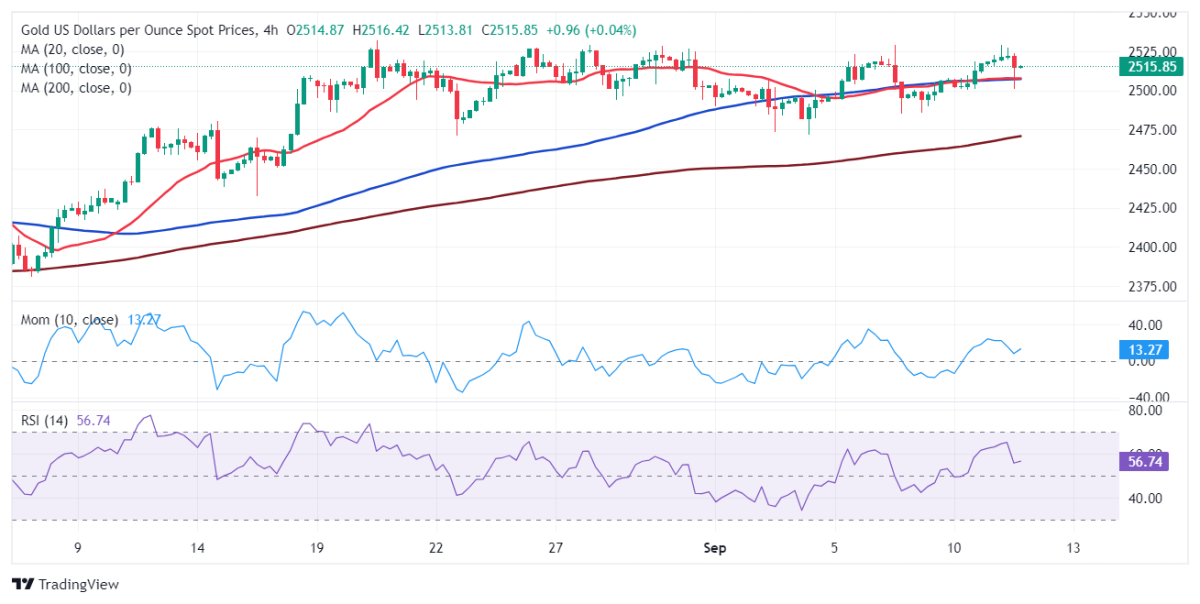
(Spot gold 4-hour chart source: FXStreet)
Bednarik gave the latest important support and resistance levels for gold prices:
Support levels: $2507.60 per ounce; $2489.60 per ounce; $2475.70 per ounce
Resistance levels: $2519.75/oz; $2531.60/oz; $2545.00/oz
At 11:11 Beijing time, spot gold was reported at 2513.44 US dollars/ounce.