
To gain an edge, this is what you need to know today.
Hotter Core CPI
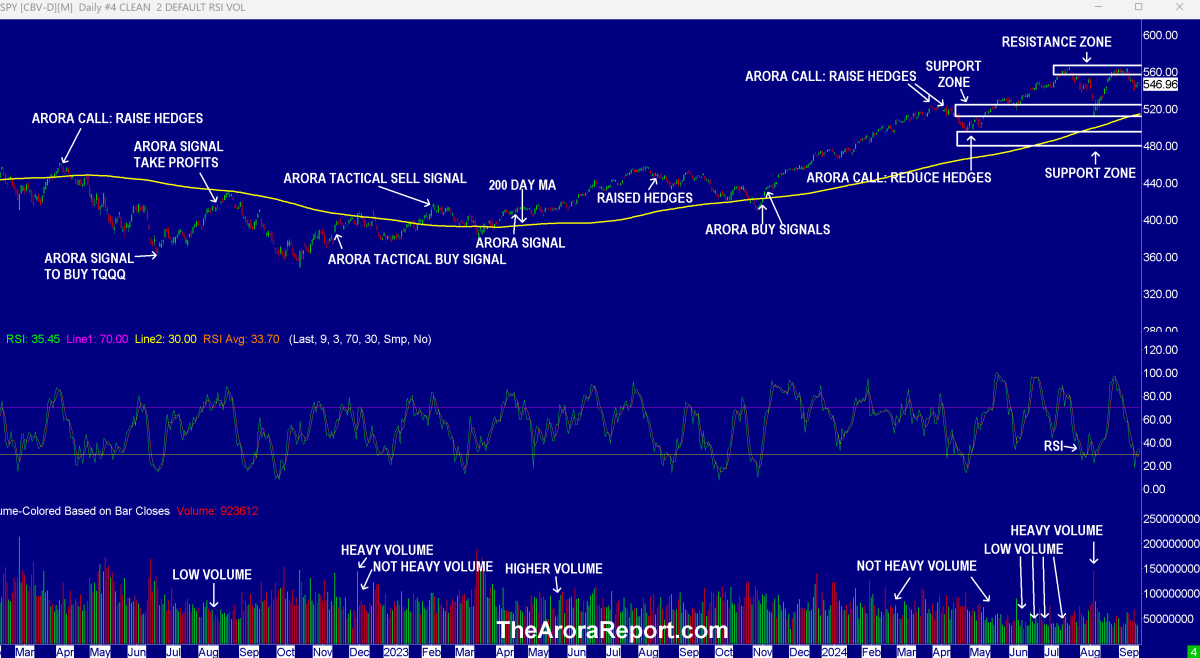
Please click here for an enlarged chart ofSPDR S&P 500 ETF Trust(NYSE:SPY) which represents the benchmark stock market index S&P 500 (SPX).
Note the following:
- The chart shows a slight pullback in the stock market after the release of CPI this morning.
- The chart shows that the stock market has made a double top in the resistance zone. In the short term, this is a negative pattern.
- The chart shows that the stock market is consolidating between the support zone and resistance...
Login or create a forever free account to read this news
Sign up/Log in
