
US stocks may peak this month (if Trump is elected, US stocks may also have a honeymoon period of about six months), and gold may be used as an ATM, while pulling down gold prices when the stock market falls.
According to the financial app Cailian Press, the European Natural Resources Fund Commodity Discovery special analyst Li Gangfeng wrote on Refinitiv that unless the Federal Reserve reduces interest rates by 50 basis points on September 18, a reduction of only 25 basis points is likely to trigger the traditional investment wisdom of 'buying on rumors, selling on confirmation of news', after all, the (Western) market has been deploying interest rate cut trades since the first half of 2023 and it's time to profit. In other words, US stocks may peak this month (if Trump is elected, US stocks may also have a honeymoon period of about six months), and gold may be used as an ATM, while pulling down gold prices when the stock market falls. But currently, whenever the gold price drops sharply, funds clearly enter for bargain hunting.
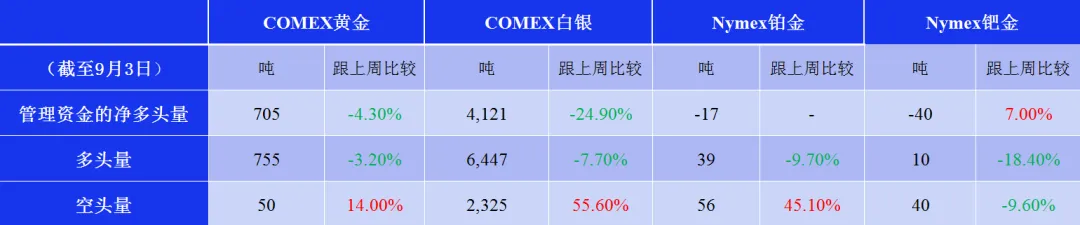
Data source: CFTC/LSEG Workspace
For comparison, the metal equivalent of COMEX gold is divided by 10, and COMEX silver's metal equivalent is divided by 100.
Currently, the reference value of Nymex palladium is very low.
As of last Tuesday, various metal funds in the US futures market showed a decrease in long positions but a significant increase in short positions, leading to a net long position unwinding, which reflects the market's transition from interest rate cut trades to recession trades.
In the US futures market, gold fund long positions fell slightly by 3% from the previous week for the second consecutive week; at the same time, fund short positions rose by 14%. As a result, fund holdings fell from a net long of 737 tons to 705 tons, marking the 47th consecutive week of net long positions (previously 46 weeks of net long positions), also representing 78% of the historical high of 908 tons in September 2019 (a decline from the recent peak level). Until September 3rd, the US dollar gold price has accumulated a 20.7% increase this year (previous week +22.3%), while fund long positions have accumulated a 35.9% increase during the same period (previous week +40.5%).
Silver, which has a high correlation with gold prices, always exhibits stronger fluctuations than its cousin. In the US futures market, silver fund long positions fell by 8% from the previous week; fund short positions surged by 56%. As a result, fund holdings fell from a net long of 5487 tons to 4121 tons, the lowest level in the past three weeks and the 26th consecutive week of net long positions, representing 27% of its peak period. As of September 3rd this year, the US dollar silver price has accumulated an 18.0% increase this year, with silver fund long positions accumulating a +12.9% increase (previous week +22.3%) and short positions accumulating a 24.1% decrease (previous week -51.2%).
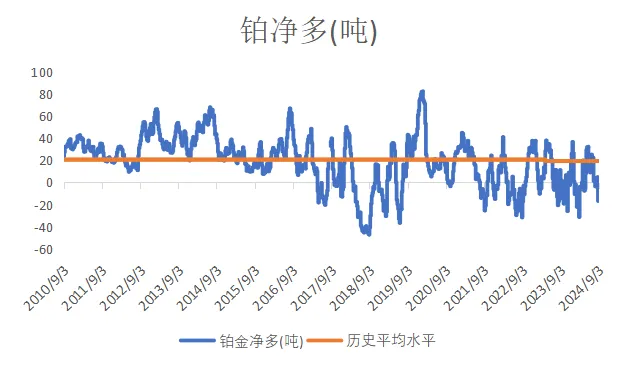
The net long position of the Platinum ETF in the United States fell by 10% compared to the previous week, but the short position surged by 45% at the same time. As a result, the net long position of the fund fell from 5 tons to a net short position of 17 tons, the lowest level in the past 26 weeks, ending two consecutive weeks of net long position. In history, the longest continuous net short position of the Platinum ETF in the United States lasted for 31 weeks (from April 2018 to October 2018).
The net short position of the Palladium ETF in the United States has risen to 40 tons, continuing to hover at the lowest level in history. Even though the bull market in palladium has ended, it may still be difficult for other precious metals to fully turn around if palladium continues to maintain a huge net short position for one day. The net short position of the Palladium ETF in the United States has been at a historical low for 94 consecutive weeks.
The net long position of the fund in U.S. futures gold has risen by 67% from the beginning of the year to now (an accumulated increase of 101% in 2023).
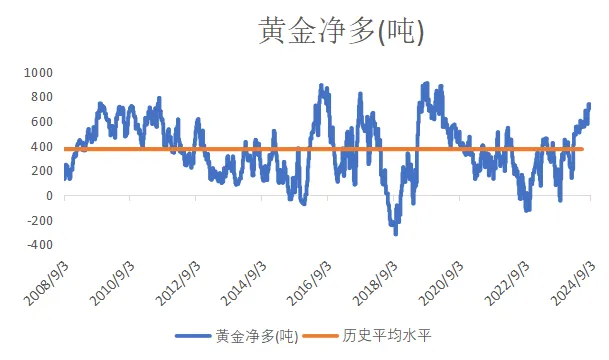
Data source: CFTC/LSEG Workspace
The net long position of the fund in U.S. futures silver has risen by 56% from the beginning of the year to now (an accumulated decrease of 44% in 2023).
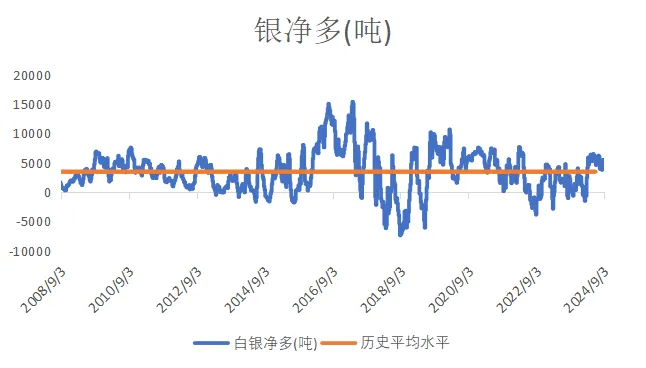
Data source: CFTC/LSEG Workspace
The net long position of the fund in U.S. futures platinum has fallen by 164% from the beginning of the year to now (an accumulated decrease of 7% in 2023).
Data source: CFTC/LSEG Workspace
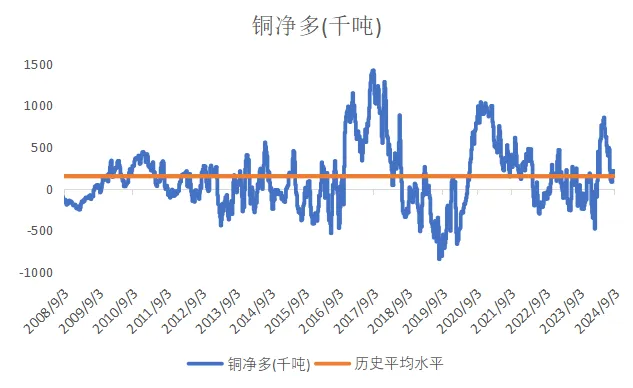
The fund's net long position in copper futures in the United States has fallen by 3% from the beginning of the year to the present (with a cumulative decline of 0.3% in 2023).
Data source: CFTC/LSEG Workspace
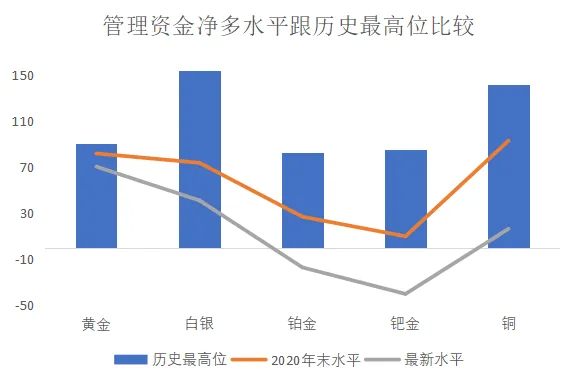
Basically, it can be seen from the chart above that despite the global inflation in the past few years, the prices of various metals have shown varying degrees of decline. The main reason is that the futures market lacks funds to drive leverage. If someone had a crystal ball years ago and knew about the current global inflation, conflicts, and uncertainties, and went long on precious metals in the futures market, it is very likely that they would lose money. The most ironic thing is that since the global spread of the pandemic in 2020, the net long position in precious metals in the US futures market has been continuously declining, reflecting that the funds have a deliberate intention to prevent precious metals from rising.
CFTC's weekly reports on the COMEX copper market have been available since 2007. Due to the bear market in copper from 2008 to 2016, most of the time the net position in copper futures in the US has been negative, which is not surprising. However, starting from 2020, due to the impact of the global pandemic on the supply side and mining operations, and the market's expectation of strong demand for copper in electric vehicles, copper prices have risen, reaching new historical highs. But the current global investment concept is that the world is entering an economic recession, leading to a decrease in demand for commodities.
As the US presidential election approaches (in October) or in 2025, caution should be exercised against a decline in copper prices. Copper prices are closely related to the US stock market.
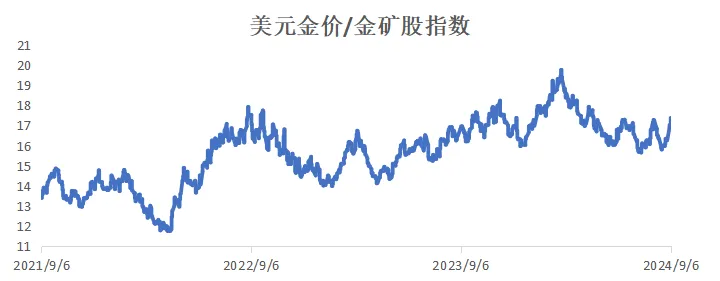
The updated gold price indicator provides important insights into the short-term direction of gold mining stocks. Last week, the ratio of the price of gold in US dollars to North American gold mining stocks increased:
Data Source: LSEG Workspace
As of Friday (6th), the ratio of the price of gold in US dollars to North American gold mining stocks was 17.37X, up 6.8% from 30th September (16.27X). The ratio reached a new high of 19.22X (closing price basis) 29 weeks ago. It has increased by 5.7% year-to-date. In 2023, it has accumulated a rise of 13.2% (6.4% in 2022), with the highest ratio in 2023 being 17.95X, and the lowest ratio in January 2023 and 2022 being 13.99X and 11.24X, respectively.
Tracking the stock price of overseas gold mines is one of the more reliable forward-looking tools, if the gold price continues to rise but the gold mining stocks experience a sharp decline, caution is warranted.
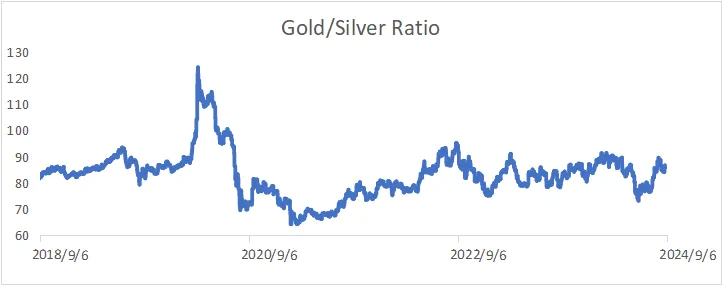
Gold-to-silver ratio
The gold-to-silver ratio is an indicator of market sentiment. Historically, the gold-to-silver ratio has ranged from approximately 16 to 125.
Data Source: LSEG Workspace
Generally, the more fearful the market, the higher the gold-to-silver ratio. For example, in 2020, the spread of the virus globally led to a historical high in the gold-to-silver ratio, which once reached over 120 times.
Last Friday, the gold-to-silver ratio index was 89.43, up 3.1% compared to the previous period, with a cumulative increase of 3.1% this year. In 2023, it has increased by 14.0% cumulatively, with the highest and lowest levels in 2023 being 91.08 and 75.93, respectively. It dropped by 3.1% in 2022.
It is important to note that both the US dollar gold price/North American gold mining stocks ratio and the gold-to-silver ratio are clearly showing a trend of rebounding from the bottom. The financial market has clearly entered into recession trading.
The market anticipates a sharp increase in the probability of a 0.25% interest rate cut by the US in September.
The market believes that the probability of a 0.5% interest rate cut in the September 18th meeting has dropped sharply from 49% five weeks ago to 30% last Friday.
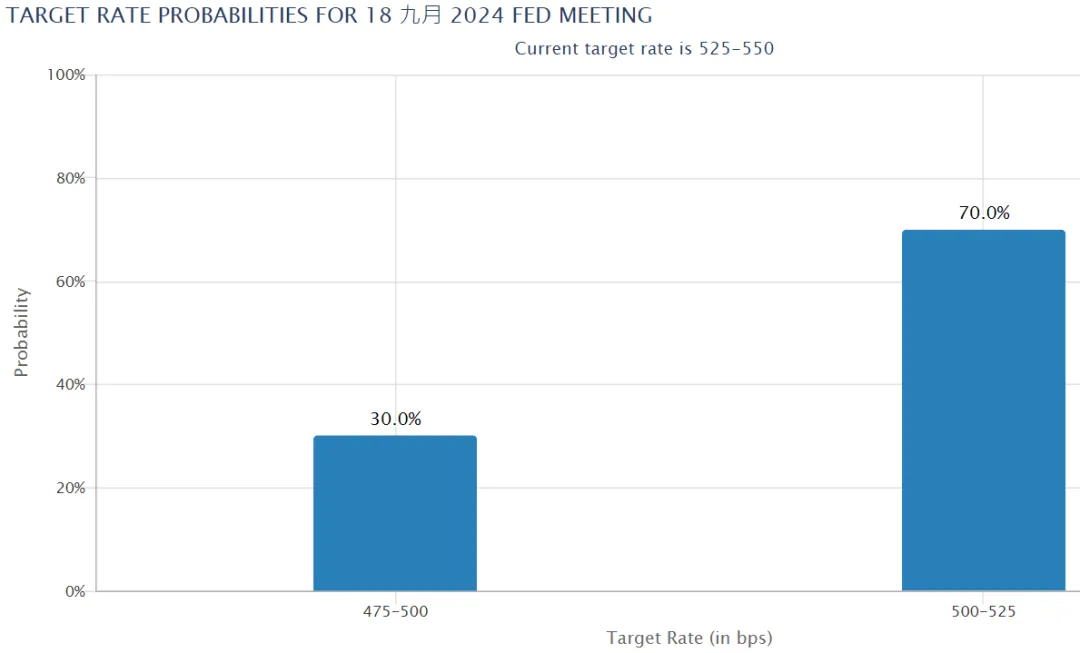
Image source: CME Group
This is a probability distribution chart for interest rates in the US in December 2024, predicted by the futures market.
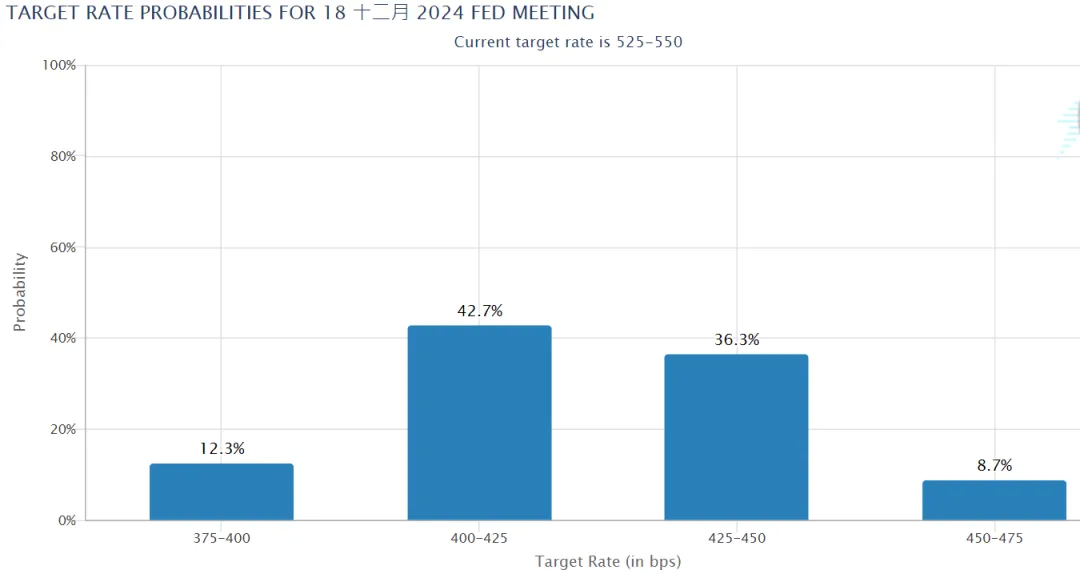
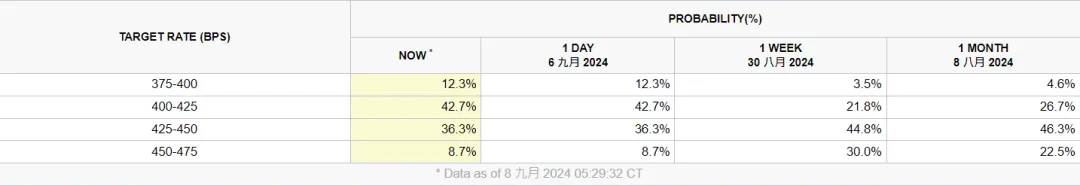
Image source: CME Group
As of last Friday, the mainstream view in the market is that the US will cut interest rates 3-4 times this year (the probability of cutting interest rates only twice has dropped to zero), or an equivalent of 0.75% -1% reduction this year.
More than a month ago, the market believed that there was a 64.9% chance that the US interest rate would decrease to 4.50%-4.75% by the end of the year. However, this probability has now plummeted to 8.7%. The market believes that the pace of interest rate cuts in the US will be more aggressive than the previous week, and the probability of reducing interest rates to 4.00%-4.25% has surged from 21.8% a week ago to 42.7%. This adjustment in the market's expectations for US interest rates this year once again confirms what has been said: the futures market's predictions of US interest rate trends, especially long-term expectations, are generally incorrect.
I won't mention the economic data in the US, as they are just excuses for the overall market decline. However, as I have been emphasizing, it is evident that the market is trending downward, so it is advisable to gradually reduce holdings of risk assets. Clear indicators include the gold/silver ratio and the US dollar gold price/North American gold mining stock index rebounding from their lows, reflecting an increase in market risk awareness.
Image source: CME Group
The US Department of Labor has revised downward the new job data for the past year, indicating that the market has misjudged the US economic environment.
Bajun announced that it has been reducing its holdings of Bank of America since mid-July. With such a large amount of cash holdings, it is evident that Bao is not optimistic about the US stock market.
Retail investors bought $5.9 billion worth of Nvidia stocks in August, reaching a historical high (a 600% increase compared to May). It is obviously the distribution by funds and company management, and retail investors are catching the hot potato at a high level.
In fact, it is not too difficult to make money in the investment market in the long run. In addition to being bold, careful, and quick to react, it is nothing more than following the crowd when everything is going well, but doing something against human nature before turning point comes. In foreign countries, it is also possible to make money in both bull and bear markets.
Unless the Federal Reserve reduces interest rates by 50 basis points on September 18, reducing rates by only 25 basis points is likely to trigger the traditional investment wisdom of 'buy on rumors, sell on news'. After all, Western markets have already started deploying interest rate reduction trades in the first half of 2023, and it is time to take profits. In other words, the US stock market may peak this month (if Trump is elected, the US stock market may have a honeymoon period of about six months), and gold may become a cash machine, pulling down the gold price when the stock market declines. However, at present, whenever there is a sharp drop in gold prices, funds clearly pour in for bottom fishing.
The biggest test in the next 12 to 24 months is what the Federal Reserve will do if the US begins to cut interest rates but inflationary pressures regain momentum.
Do not overlook the possibility of a deteriorating situation in the Middle East. It is not ruled out that Chunjiang Duck may deploy gold ahead of time in response to the situation in the Middle East.
Although the local currency has appreciated in recent times, it is only a temporary reversal after the previous strong US dollar squeeze. Especially although last week's eco-friendly stocks rebounded across the board, I am more inclined to believe that this rebound is just a ****, luring more funds to enter the market and catch the hot potato. Therefore, my personal suggestion is to gradually reduce risky assets during this rebound period (but not sure how long it will last) and secure profits.