
Source: Zhongjin Dim Sum
Author: Liu Gang, Wang Muyao
CICC Research
Since August, Hong Kong stocks have emerged from an “independent market” that is different from A-shares, verifying our view that Hong Kong stocks are more flexible than A-shares (“Hong Kong stocks are more resilient” and “Hong Kong stocks have “independent market” and structural opportunities). In addition to more thorough valuations and position clearing, the profit advantage of Hong Kong stocks over A-shares is undoubtedly an important reason. Furthermore, while the market is likely to continue to fluctuate, which sectors have higher prosperity or inflection points in performance will also bring better structural opportunities?
Based on the interim report results and market expectations that have already been disclosed, sectors such as Internet e-commerce and consumer services are booming, while the profits of utilities such as telecommunications, hydropower, etc. are stable, and they still deserve continued attention as dividend indicators.
The profit growth rate of overseas Chinese stocks improved year-on-year in the first half of the year, but it was more cost driven than demand, and companies generally adopted a contraction strategy.
Hong Kong stocks are significantly better than A-shares -3%, mainly because Hong Kong stocks have an advantage in terms of profit structure: 1) In terms of industry structure, Hong Kong stocks account for a high share of the new economy, and the midstream manufacturing sector accounts for a low share. 2) In terms of concentration, the contribution effect of leading companies is more obvious.
We slightly lowered growth for the full year of 2024 from 3-4% to 2%. We recommend focusing on booming areas such as e-commerce, internet, consumer services, etc.; in addition, the steady performance of utility sectors such as telecommunications, hydropower, etc. is also worth paying attention to as dividend points.
Growth situation: 2.3% increase in the first half of the year, better than A-shares; Internet e-commerce grew rapidly, export chains and metals were highlights, and real estate and banks dragged down
The profit of overseas Chinese stocks increased 2.3% year-on-year in the first half of 2024, up from 0.2% in 2023. In comparable terms, in Hong Kong dollars, earnings in overseas Chinese stock markets increased 2.3% year-on-year, with finance falling 1.1% year over year (vs. -2.7% in 2023) and non-financial growth of 6.3% (vs. 3.9% in 2023).
Metal mining and export chains are highlights. The e-commerce Internet has maintained high growth, and real estate and banking are declining at an accelerated pace. By industry,
1) Upstream resource product restoration. Raw material profits increased 24.0% (vs. 2023 -27.1%), and price increases boosted the performance of the metal mining sector; energy profits declined slightly by 1.0% (vs. -15.0% in 2023), which was mainly dragged down by falling coal prices. Instead, oil and gas profits increased 6.0%, which was corrected from a 12.4% decline in 2023.
2) Midstream manufacturing is weak. Higher prices for upstream resource products squeezed profits, and profits for capital goods fell 8.9% (vs. -7.3% in 2023); airline losses were reduced, and the performance of some shipping and port companies improved due to rising freight rates; the automotive and parts sector grew 17.6%, up 9.9% from 2023. The support was mainly due to a 0.4ppt (vs. 2023-0.5ppt) year-on-year increase in profit margins (vs. 2023-0.5ppt), but revenue increased 6% year over year, which slowed from 22.3% in 2023.
3) Downstream consumption is resilient. Essential consumption increased by 1% (vs. -3.9% in 2023), optional consumption increased by 49.4% (vs. 67.3% in 2023), benefiting from exports of durable consumer goods (+30.9%) and the e-commerce sector.$PDD Holdings (PDD.US)$, $JD-SW (09618.HK)$ , $MEITUAN-W (03690.HK)$ Earnings grew by double digits.
4) Overall TMT was strong, with semiconductors alone falling by 33.7% (vs. -41.2% in 2023), software service losses were drastically reduced. Telecom and technology hardware grew by 2% and 20%, respectively, better than 1.2% and 17% in 2023, and media and entertainment maintained a rapid growth rate of 32.8% (vs. +49.8% in 2023).
5) Defensive healthcare and utilities declined at a high base, with healthcare falling 2.8% (vs. +37.2% in 2023) and utilities growing 0.7% (vs. +42% in 2023).
6) Financial real estate profits declined, dragging down overall performance. Real estate accelerated decline of 52.1% (vs. 2023 -15.2%), $CHINA VANKE (02202.HK)$ A sharp shift in profits dragged down sector performance; financial profits fell 1.1%, narrower than the -2.7% decline in 2023, and insurance (+19.3%) profits were clearly repaired, but narrowing interest spreads accelerated the decline in bank profits (-4.5% vs. -2.9% in 2023), and diversified finance (-7.3%) performance was also at the bottom.
Despite this, Hong Kong stocks are still significantly better than A-shares -3%, especially in the non-financial sector, which increased 6.3% year over year, and fell 5.5% compared to A-shares in non-financial markets [1]. The reason for this is mainly because the profit structure of Hong Kong stocks is more advantageous:
1) In terms of industry structure, Hong Kong stocks account for a high share of the new economy and a low share of the midstream manufacturing industry. The e-commerce and internet sectors, which had double-digit year-on-year earnings growth in the first half of the year, had a large share of Hong Kong stocks, accounting for close to 20% of market capitalization, while the majority of such companies were concentrated in A shares, such as the industrial sector, which accounted for more than 18% of the market capitalization, which was significantly higher than 7% of Hong Kong stocks. Among them, the power equipment and new energy sector, which had a 53% year-on-year decline in profit in the first half of the year, accounted for 5% of the market value of A-shares, accounting for only 0.5% of Hong Kong stocks.
2) In terms of concentration, the contribution effect of leading companies is more obvious. The top 10 overseas Chinese stock market capitalization companies accounted for 44% of the total net profit in the first half of the year. The top 20 companies accounted for 60%, while the top 10 A-share companies accounted for only 33% of net profit, and the top 20 companies accounted for 45%. Therefore, the performance of leading companies has a greater impact. $TENCENT (00700.HK)$ , Meituan, CNOOC, etc. performed well in the first half of the year, all with double-digit growth. The division into sectors is more obvious, the automobile sector,$GWMOTOR (02333.HK)$, $XPENG-W (09868.HK)$ , $BYD COMPANY (01211.HK)$ The overall increase in basic contributions; in transportation, $CHINA EAST AIR (00670.HK)$ Significant loss reduction and$JD LOGISTICS (02618.HK)$Performance exceeding expectations also drove more than half of the increase; in energy, $CNOOC (00883.HK)$ The year-on-year increase was 19.8%, which basically offset the drag of the decline in coal.
Quality of growth: More cost driven than demand, companies generally adopt contraction strategies
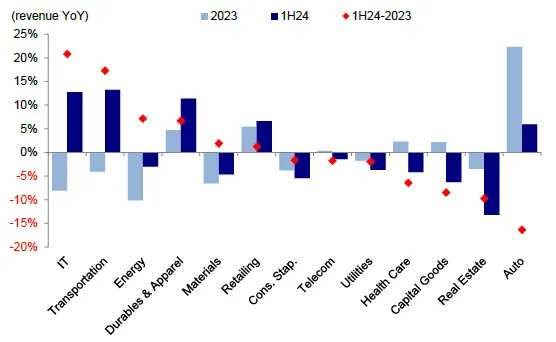
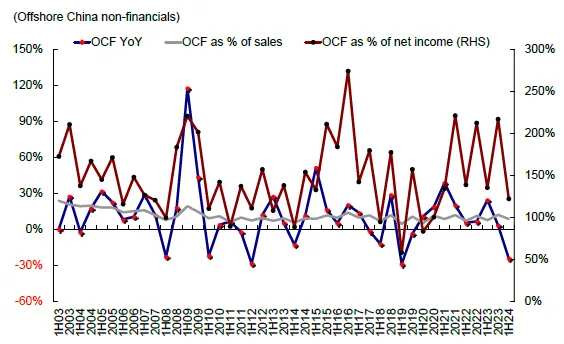
Profit improvements were more cost driven, and demand declined. The net profit margin of overseas Chinese stocks increased by 1ppt from 5.2% in 2023 to 6.2% in the first half of the year. Compared to 2023, net profit margins improved in most sectors. Net profit margins in sectors such as media and entertainment (+5.4ppt), retail (+3.4ppt), utilities (+2.7ppt), and consumer durables and apparel (+2.3ppt) improved markedly compared to 2023, with only the real estate sector falling 0.8 ppt. Taxes and fees for overseas Chinese listed companies were reduced in the first half of the year, and the year-on-year growth rate of interest expenses slowed. Businesses reduce costs to maintain operations in an environment of weak demand. In contrast, revenue from the non-financial sector fell 1.3% year on year (vs. -1.3% in 2023), and operating cash flow fell 24.4% year on year (vs. 3.2% in 2023). Among them, revenue from sectors such as transportation (+13.2%), information technology (+12.7%), and durable consumer goods (+11.4%) achieved positive year-on-year revenue growth in the first half of the year, which was a significant improvement over the revenue growth rate in 2023, while sectors such as automobiles (-16ppt), real estate (-10ppt), capital goods (-8ppt), and healthcare (-6ppt) increased The pace is significantly slower than in 2023.
Corporate investment has shrunk, and net debt has declined. Capital expenditure on overseas Chinese stocks fell 4.2% year on year in the first half of the year. The leverage ratio is basically the same as 343% in 2023. Among them, the capital goods leverage ratio increased the most (+41ppt); the transportation leverage ratio declined by 10ppt. Notably, the net gearing ratio (net gearing) fell from 45% in 2023 to 41% in the first half of 2024, and companies are deleveraging. At the same time, in the context of inventory removal in the first half of 2024, inventory and inventory sales ratios continued to decline, accounts receivable increased year-on-year, and in an environment where return on investment and domestic demand momentum were insufficient, enterprises were limited in their willingness to invest and expand, and adopted contractile management strategies.
As a result, higher ROE is more due to cost-driven profit margins. ROE increased from 10.9% in 2023 to 11.6% in the first half of 2024. Among them, the financial sector's ROE remained the same as in 2023 at 10.8%; the non-financial ROE rose from 11.0% to 12.7%; the insurance, essential consumption, utilities, and telecommunications sectors expanded by 7.9, 4.4, 3.5, and 2.5ppt respectively; and the banking, information technology, and capital goods sectors declined by 0.5, 0.4, and 0.3 ppt, respectively. According to DuPont's analysis, rising net profit margins support higher ROE. The leverage ratio is basically flat, and the asset turnover ratio fell to 47% from 49% in 2023. It is difficult for companies to obtain new profit growth points when demand is insufficient, and profitability is limited.
Growth prospects: slightly lowered to 2% for the full year of 2024; it is recommended to focus on e-commerce Internet, consumer services, telecommunications and utilities
Currently, market consensus expects overseas Chinese stocks to grow 9.5% for the whole year, implying a year-on-year increase of nearly 20% in the second half of the year. In terms of sectors, the market unanimously expects e-commerce, insurance, media and entertainment to remain the main contributors to profit growth; consumer services, real estate, insurance, semiconductors and other sectors may be significantly better in the second half of the year.
We believe that the market's unanimous expectations may be too optimistic, or there is a synthetic error. On the one hand, effective demand is still insufficient, land production prices are operating weakly, prices continue to be under pressure, and the situation of weak momentum within economic growth still needs to be fundamentally improved. On the other hand, exports stabilized in the first half of the year, which were better than market expectations to support the profits of export chain enterprises, but recently freight rates have continued to fall, and exports may weaken month-on-month in the second half of the year. The root cause of the current growth pressure problem is still credit contraction. In particular, fiscal strength has slowed again since February and the second quarter of this year, making it impossible to effectively hedge against continued “deleveraging” in the private sector. Solutions include reducing financing costs and increasing fiscal leverage. The fiscal deficit accelerated year-on-year in July, and the Fed's interest rate cut in September will also provide an easing window for domestic policies, but the Ministry of Finance may also focus on implementing existing policies during the year. Recently, the Ministry of Finance also emphasized “resolutely preventing the introduction of policies and new projects beyond financial resources [2],” so it is unrealistic to expect “strong stimulus”. Fundamentally, there is no foundation for rapid profit growth in the second half of the year.
Under the benchmark situation, based on actual growth in the first half of the year, we lowered our 2024 profit growth forecast from 3-4% to 2%, which is lower than the current 10% consensus forecast. However, due to the relatively high share of the new economy sector and the low share of manufacturing, Hong Kong stocks will still perform better than A-shares. At the sector level, we recommend focusing on areas with high prosperity, such as e-commerce, internet, consumer services, etc. The year-to-date profit improvement in these sectors. The ROE forecast for 2024 is higher than the average for the past 5 years, and the PB level is lower than the average for the past 5 years, which is expected to be a highlight in the overall moderate growth trend of performance; in addition, utility sectors such as telecommunications, hydropower, etc. have steady performance, and it is also worth paying attention to as dividend targets.
From a market perspective, combined with profits and the impact of the Federal Reserve's interest rate cut, we still believe that Hong Kong stocks are more flexible than A-shares. Growth sectors that benefit from interest rate cuts in the short term may be more resilient, such as semiconductors, automobiles (including new energy), media and entertainment, software, biotechnology, etc. However, in the medium term, the structural market with fluctuating ranges is still the main line. The current 10-year US bond interest rate drop to 3.8% has fully taken interest rate cut expectations into account. If the risk premium returns to the middle of last year, it corresponds$Hang Seng Index (800000.HK)$Approximately 19,000; if profit increases 10% on this basis, the corresponding Hang Seng Index point may be around 21,000. The direction of allocation depends on the basic outlook. Dividend+technology growth is the main line: 1) declining overall returns, high dividends and high repurchases, that is, “cash bulls” with abundant cash flow, from cyclical dividends to bank dividends to protect against low-wave dividends; 2) partial leverage, such as technological growth (technology hardware and semiconductors) with their own industry prosperity (Internet, gaming, education) or policy support.
Overall profit: 2.3% year-on-year, better than A-shares, high e-commerce Internet growth
Chart 1: Summary of the overall 2024 interim results of overseas Chinese stocks
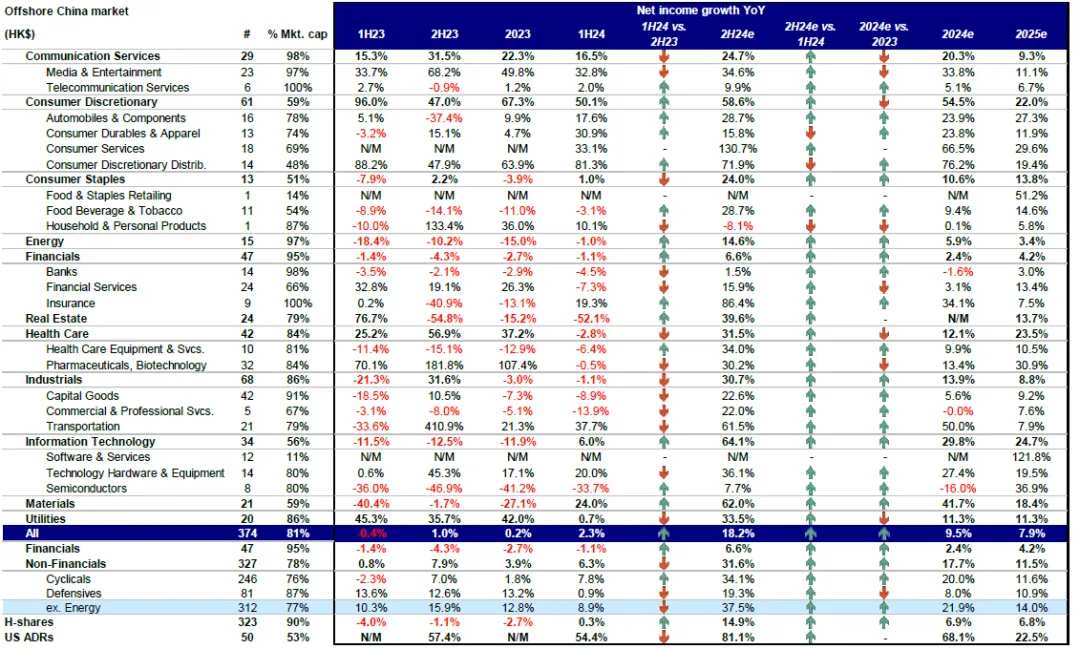
Note: In Hong Kong dollars; companies with missing data and a fiscal year that did not end in December are not included in the table above; based on Bloomberg's consistent expectations rather than CICC's top-down forecast
Chart 2: The optional consumer, media and entertainment, and insurance sectors contributed the most to profit growth in the first half of 2024, while the banking and real estate sectors were a drag
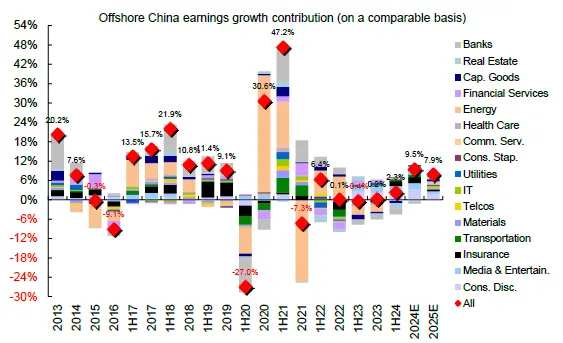
Chart 3: Summary of profits, revenue, profit margins and ROE levels of overseas Chinese stocks in the first half of 2024
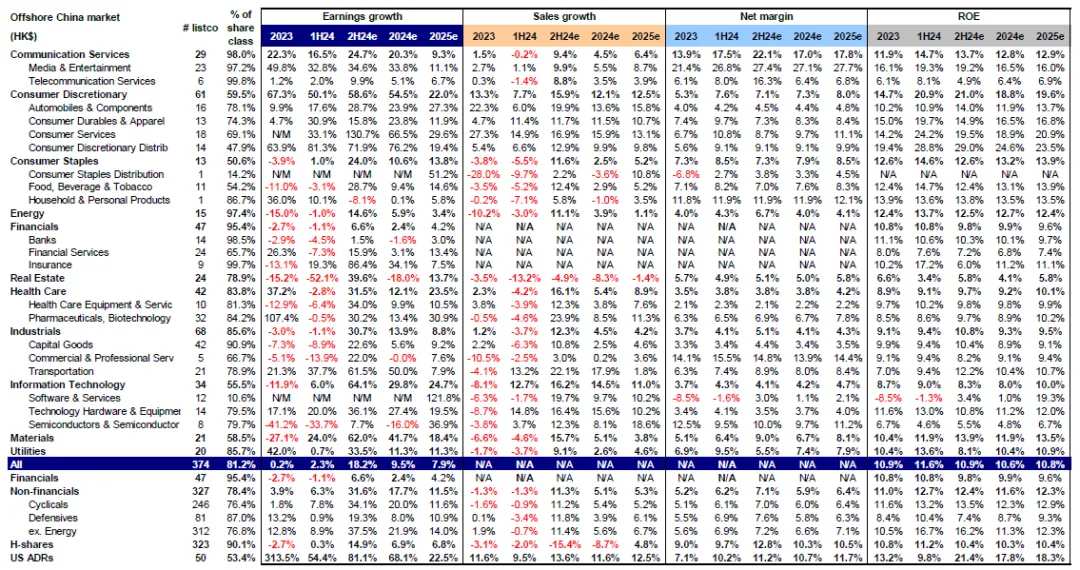
Note: In Hong Kong dollars; based on a comparable caliber; companies with missing data and a fiscal year not ending in December are not included in the above table; based on Bloomberg's consistent expectations rather than CICC's top-down forecast
Growth drivers: more cost driven than demand
Chart 4: Declining revenue dragged down profit growth in the first half of the year
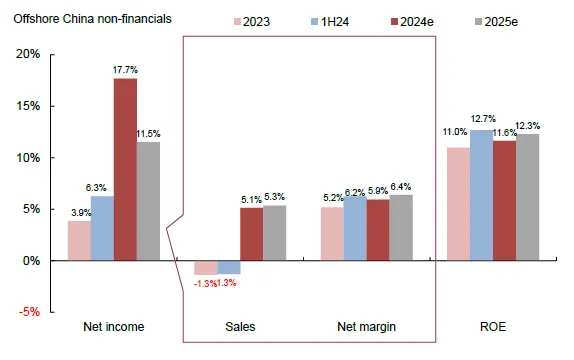
Chart 5: The rise in net profit margin was the main reason for the slight increase in profit
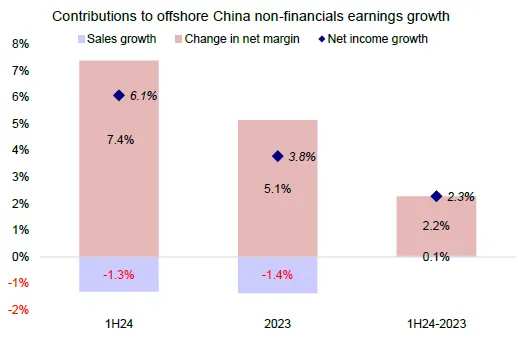
Chart 6: Revenue declined further in the first half of the year
Chart 7: Revenue growth in the automotive, real estate, and capital goods sectors has slowed markedly
Quality of growth: investment is declining, leverage is falling, and more contraction strategies are being adopted
Chart 8: Increased ROE, mainly due to rising net profit margins
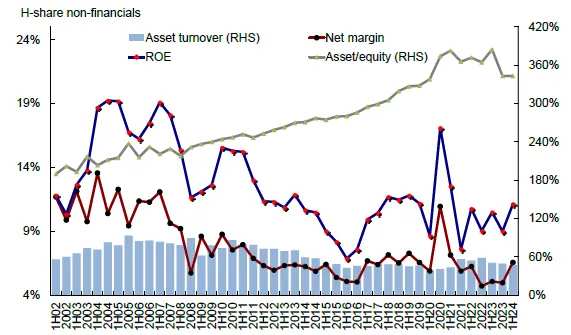
Chart 9:... The net debt ratio has declined, the share of corporate cash holdings has increased, and the financial structure of enterprises is tending to be conservative
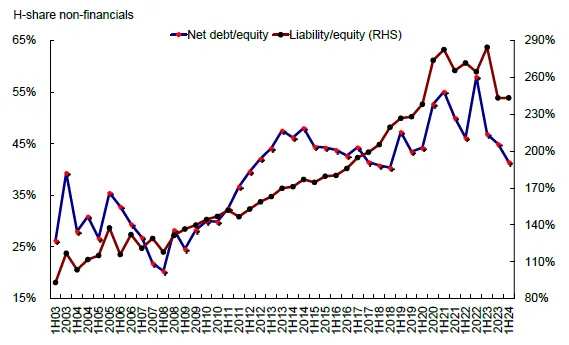
Chart 10: Interest coverage multiples increased, and interest expenses declined year-on-year
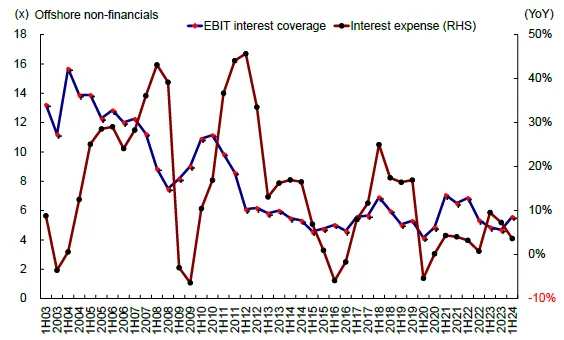
Chart 11: Taxes decreased year over year, tax coverage increased
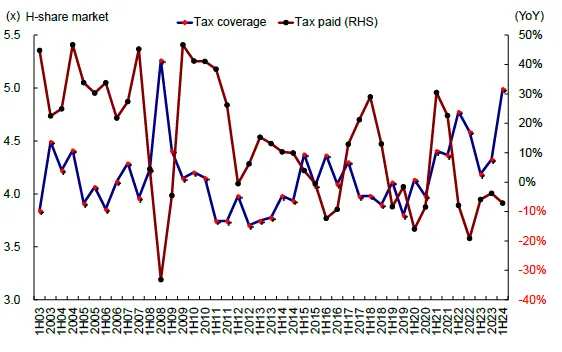
Chart 12: Companies continue to go to warehouses, and the rate of inventory removal slowed in the first half of the year
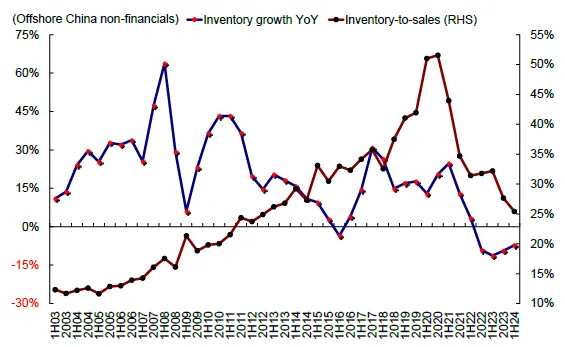
Chart 13: Year-over-year decline in operating cash flow
Outlook: Consistent high expectations, slightly lowered to 2% for the whole year
Chart 14: Consumer services, e-commerce, media and entertainment sectors are attractive at ROE and PB levels
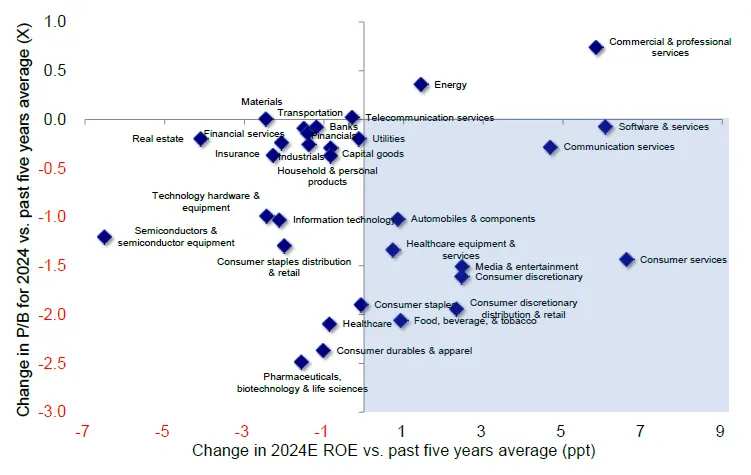
Chart 15: Profit expectations have risen since 2024, and most sectors have had the highest gains
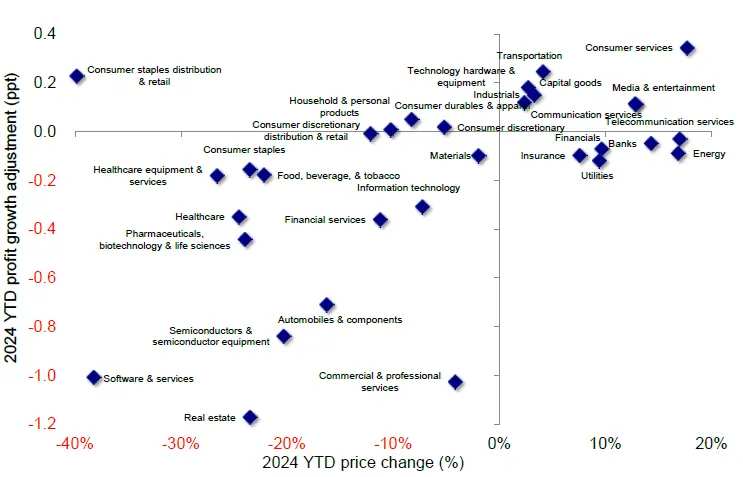
Chart 16: Hong Kong stocks have an advantage over A-shares profit structure
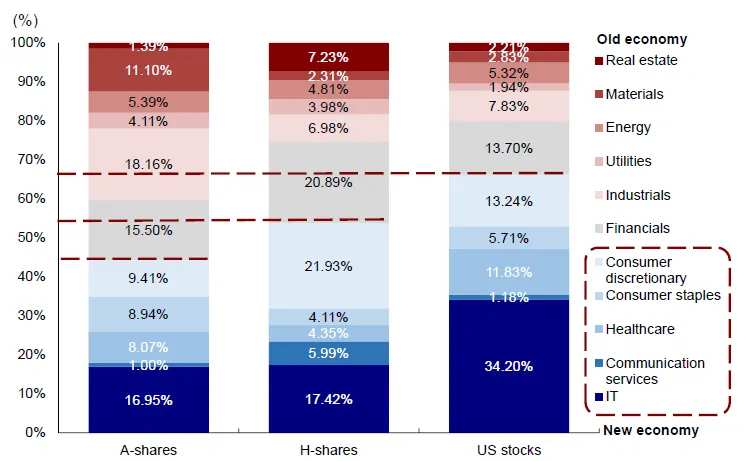
Chart 17: Year-to-date net profit forecast adjustments and FactSet's consistent growth forecast for various industries excluding the MSCI China Index
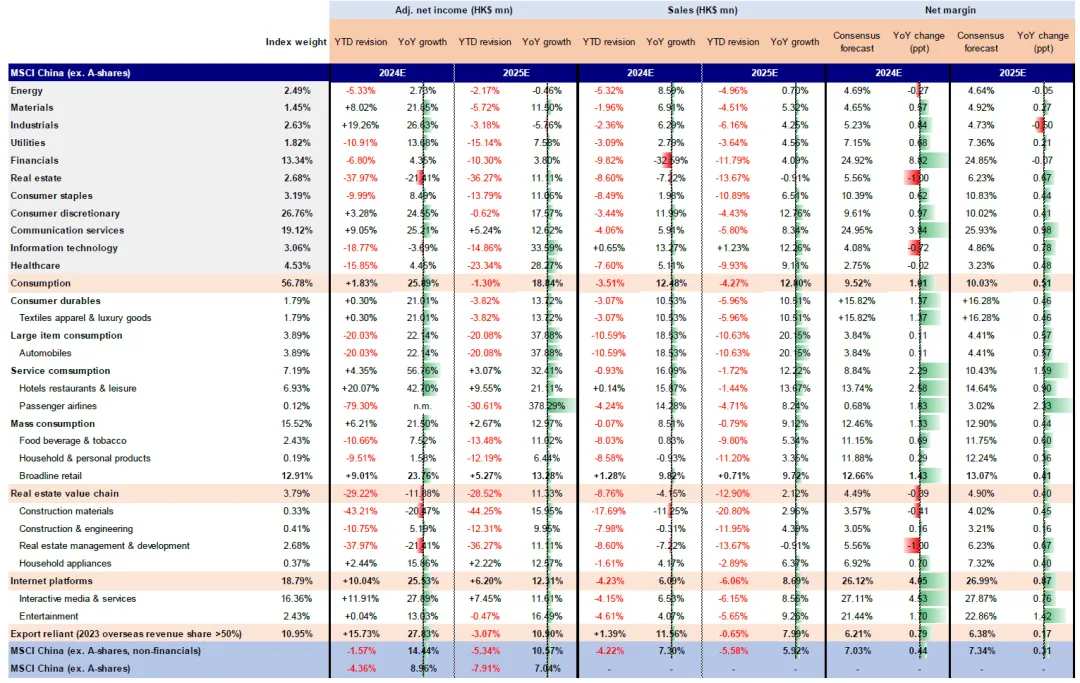
Note: Data as of September 5, 2024
[1] https://www.research.cicc.com/zh_CN/report?id=348487&entrance_source=empty
[2] https://www.yicai.com/news/102253918.html
Editor/jayden