
 衰退压力到底多大?降息25bp还是50bp,应对增长压力够不够,市场又会作何反应?各类资产计入了多少预期?这些都是市场关切且亟待解答的问题。
The number of rate cuts: 25 and 50bp fall between the two, but 25bp is still the benchmark; the easing effect has actually begun to appear.
The last non-farm data before the September FOMC meeting almost determines whether the recession concerns will intensify, and the importance of whether the Fed will cut interest rates by 25bp or 50bp two weeks later is self-evident. Powell's focus on the labor market statement at the Jackson Hole meeting also fully illustrates this ("New Thinking on Rate Cut Trades").
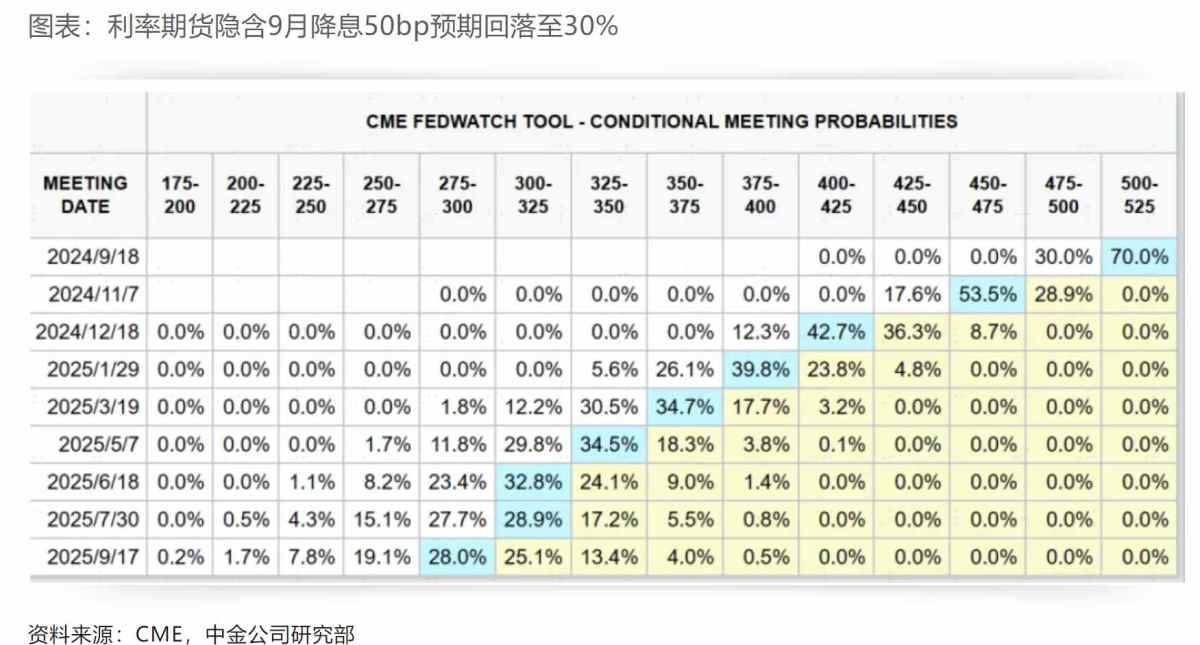
But the results did not clearly favor one over the other as expected by the market. Instead, it was more confusing, and the performance of various assets was not uniform either. As of the end of Friday's trading, the implied 70% expectation of a 25bp rate cut in September from CME interest rate futures actually increased. The 10-year bond yield repeatedly fluctuated and ultimately held at 3.7%; gold rebounded and then fell, while US stocks fell sharply again, and the US dollar index rose slightly, indicating a significant level of market confusion and divergence.
 How strong is the pressure of the recession? Will a 25bp or 50bp rate cut be enough to address the pressure on growth, and how will the market react? How much of the expectations are factored into various assets? These are all pressing questions that the market is concerned about and eager to get answers to.
The non-farm information: indeed not good, but not so bad as to "clearly favor one over the other"; slowing down but not a recession.
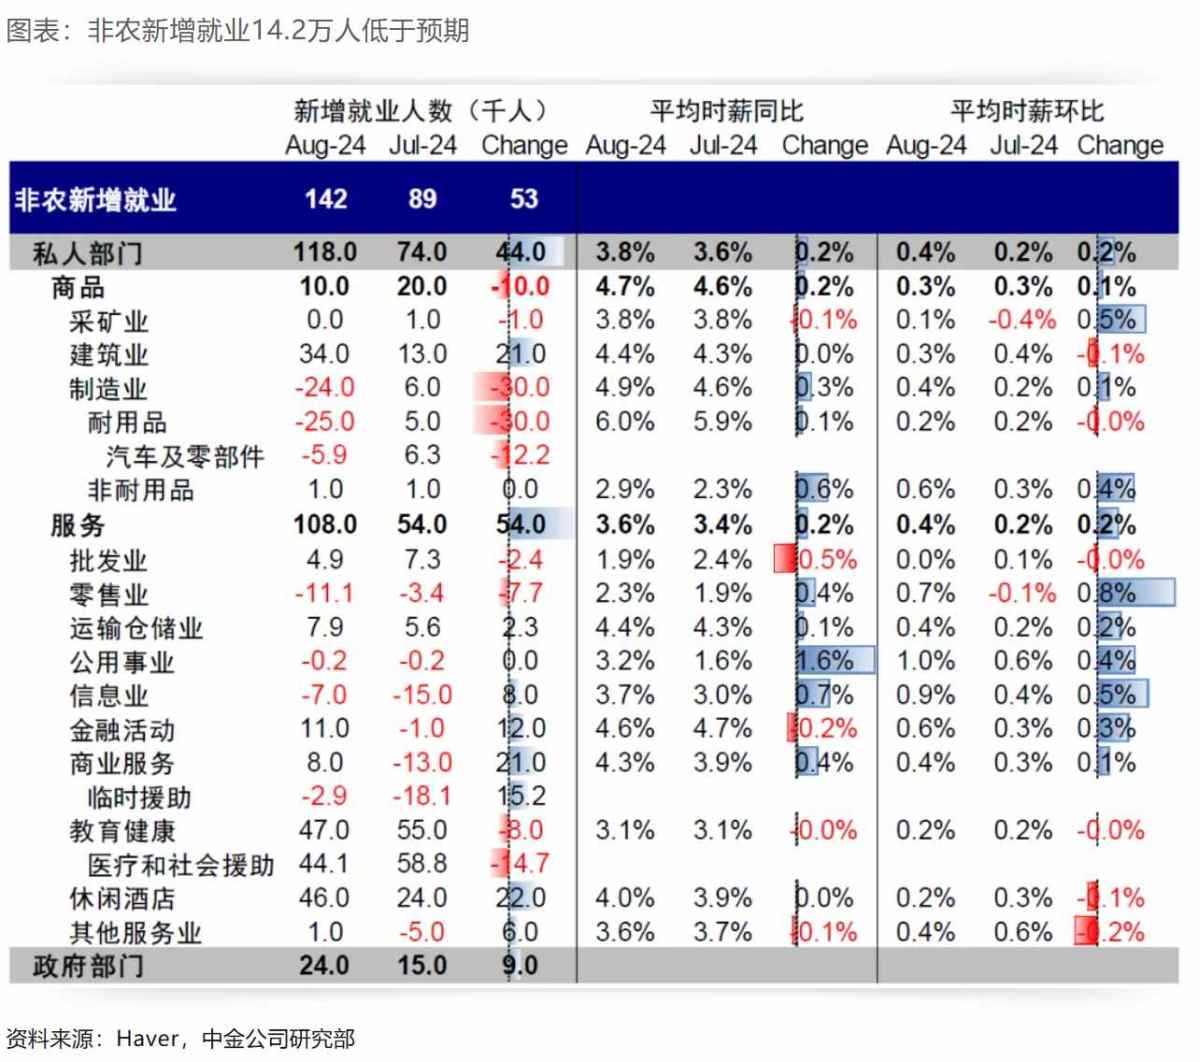
After the unemployment rate rose to 4.3% in July, triggering the so-called "Sam Rule," and with Powell emphasizing the importance of the labor market for future rate cuts, this month's non-farm data almost determined whether the concerns about a recession would be magnified, and whether the Fed will cut rates by 25bp or 50bp two weeks later. However, the data results were "mixed." They provided reasons for both optimism and pessimism, but neither side can "clearly favor one over the other": 1) The negative side: an increase of 0.142 million non-farm jobs, not only lower than the expected 0.165 million, but the data from the previous month was also significantly revised down from 0.114 million to 0.089 million. 2) The positive side: a decrease of 0.19 million temporary unemployment, basically making up for the 0.249 million temporary unemployment gap in July due to weather and other factors. In addition, the household survey added 0.168 million jobs, bringing the unemployment rate down from 4.3% to 4.2%, and the wage increase also exceeded expectations, rising to 0.4% from the expected 0.3%.

Considering that a large number of temporary unemployment caused by factors such as weather in the previous month is likely to diminish, the market had already fully anticipated a recovery this month even before the data disclosure. Only an unexpectedly strong recovery could ease concerns about a recession and dispel expectations of a 50bp rate cut; a significantly lower-than-expected recovery would further strengthen concerns about a recession. However, the final result was a decrease in the unemployment rate and the degree of job recovery was less than expected, indicating that the labor market is indeed slowing down, but not enough to confirm a recession.
As for the significant downward revision of the data, it does show a weaker reality of the labor market compared to the situation presented by the previous data. However, one objective fact is that the labor market is subject to survey methods and response rates, which makes the quality of monthly data uneven, and often faces significant revisions. The current level of revision compared to historical dispersion is not considered abnormal.
Following the non-farm payroll data, the CPI data to be released next week may also be 'lukewarm'. We estimate that the overall CPI in August will increase by 0.12% month-on-month, lower than the expected 0.2% and the previous value of 0.15%, and an increase of 2.52% year-on-year (consensus expectation of 2.6%, previous value of 2.89%); however, the core CPI will increase by 0.19%, which is basically in line with the expected 0.2%, higher than the previous value of 0.17%, and an increase of 3.17% year-on-year (consensus expectation of 3.2%, previous value of 3.17%). As Powell has already hinted at the reduced importance of inflation in future interest rate decisions during the Jackson Hole meeting, better-than-expected data may not be enough to dispel expectations of a rate cut, but a significant deviation from expectations may have a substantial impact.
The number of rate cuts: 25 and 50 basis points are both possible, but 25 basis points is still the benchmark; the easing effect has actually begun to show.
In fact, this data provides the Federal Reserve with room to maneuver. In a situation where growth is slowing but there is no evidence of a recession, market expectations show that both a 25 basis point and 50 basis point rate cut can find a 'reasonable' rationale. Although a 25 basis point rate cut may not convince the market to dispel recession concerns, a direct 50 basis point rate cut may lead to recession concerns.
We believe that 25 basis points is still the benchmark scenario, not only because we do not believe that the current situation is a deep recession ('Criteria for Determining a Recession and Historical Experience'), but also because even without a rate cut, the easing effect has actually begun to show ('New Changes in the Credit Cycles of China and the United States'). This is reflected in: 1) Real estate: After the 30-year mortgage rate followed the rapid decline of the 10-year T-note to 6.4%, it has already fallen below the average rental return rate of 7%. This has led to a resurgence in U.S. existing home sales in July after a 5-month hiatus, with existing home sales increasing for the first time in 5 months, and new home sales, which are leading indicators, increasing by 10% month-on-month in July. In addition, refinancing demand has also rebounded as mortgage rates have declined. 2) Direct financing: Investment and high-yield bond credit spreads are at historical lows of 14.6% and 32.7%, respectively, coupled with the sharp decline in benchmark interest rates, which has quickly brought down corporate financing costs. Against this backdrop, starting from the rate decline in May, U.S. credit bond issuances from May to August have grown by 20.6% year-on-year, investment-grade bond issuances have grown by 13.7%, and high-yield bond issuances have grown by 74.5%. 3) Indirect financing: In the third quarter, the share of banks tightening loan standards has fallen sharply, with mortgage loan standards even switching to easing (the percentage of banks tightening versus easing is -1.9%).

It is precisely based on the starting point of a rate cut to address the problem of high financing costs in various links that we estimate that a static look at this round of rate cuts at around 100 basis points (4-5 times) can be effective. However, the loose financial conditions mentioned above have not yet been reflected in actual macroeconomic data. This is both the 'disconnect' between slowing growth and policy loosening, and the reason for the confusion and volatility in market expectations during this stage.


Market trading: The degree of incorporation is as follows: interest rate futures, gold, copper, U.S. bonds, and U.S. stocks; 'Think and act the opposite', gradually switch after realizing gains, and gradually improve in the fourth quarter.

We believe that 25 basis points is still the benchmark, not only because we do not believe that the current situation is a deep recession ('Criteria for Determining a Recession and Historical Experience'), but also because even without a rate cut, the easing effect has actually begun to show ('New Changes in the Credit Cycles of China and the United States'). This is reflected in: 1) Real estate: After the 30-year mortgage rate followed the rapid decline of the 10-year T-note to 6.4%, it has already fallen below the average rental return rate of 7%. This has led to a resurgence in U.S. existing home sales in July after a 5-month hiatus, with existing home sales increasing for the first time in 5 months, and new home sales, which are leading indicators, increasing by 10% month-on-month in July. In addition, refinancing demand has also rebounded as mortgage rates have declined. 2) Direct financing: Investment and high-yield bond credit spreads are at historical lows of 14.6% and 32.7%, respectively, coupled with the sharp decline in benchmark interest rates, which has quickly brought down corporate financing costs. Against this backdrop, starting from the rate decline in May, U.S. credit bond issuances from May to August have grown by 20.6% year-on-year, investment-grade bond issuances have grown by 13.7%, and high-yield bond issuances have grown by 74.5%. 3) Indirect financing: In the third quarter, the share of banks tightening loan standards has fallen sharply, with mortgage loan standards even switching to easing (the percentage of banks tightening versus easing is -1.9%).
Market trading: The degree of incorporation is as follows: interest rate futures, gold, copper, U.S. bonds, and U.S. stocks; 'Think and act the opposite', gradually switch after realizing gains, and gradually improve in the fourth quarter.
As mentioned above, the current US economy has slowed down, but the Fed has not yet begun to cut interest rates, and is in a stage of 'data and policy mismatch'. At this stage, the economic data has not yet declined to the extent of a recession, but the effect of loose financial conditions has not yet fully appeared, so we believe that asset volatility is also normal, similar to before the first interest rate cut in 2019. In this sense, the decline of US stocks and gold on Friday, the downward exploration and rebound of US bond yields, and the chaos of the expectation for interest rate cuts rising instead of falling, can all be summarized as the market worrying about a recession and expecting a larger interest rate cut, but unable to find concrete evidence to prove the contradiction of a recession, so the decline of US stocks is due to the former, while the decline of gold and US bonds is due to the latter.
Essentially, this is the market's matching of the size of the recession pressure and the magnitude of the interest rate cut. If a new consensus is formed (such as implementing the interest rate cut, or improvement in economic data), reaching a new balance means that the transition is basically completed, and assets should switch from gold and US bonds to industrial metals and stocks.
This is also the case in the 2019 interest rate cut cycle. In 2019, the US fundamentals also saw a small interest rate cut under a soft landing, and similarly, there was an inverted yield curve and weakening economic data. The 10-year US bond yield began to decline before the Fed's interest rate cut, dropping from a high point of 3.2% to 1.5% after the first interest rate cut, which also became the low point of this cycle. During the decline in US bond yields, economic expectations were unstable, and risk assets experienced multiple pullbacks, while gold rose, which is similar to the current situation. Against this backdrop, US stocks experienced pullbacks of 6.8% and 6.1% before the interest rate cuts in May 2019 and July 2019, respectively.


However, the quiet change behind it is that the fall in long-term bond yields prompted a rise in US existing home sales before the interest rate cut. After the Fed's interest rate cut in July 2019, inflation began to pick up, and the improvement in economic expectations led to the bottoming out and rebound of long-term US bond yields, while gold simultaneously peaked. Copper and US stocks gradually rebounded, rather than waiting for the rate cut to end before switching ("Interest Rate Trading Manual").

This round is also generally the same. The expected interest rate cut already included in assets is quite sufficient, so unless new recession pressures appear to break the balance, consideration should gradually be given to assets that may benefit after the rate cut. Therefore, we believe that linearly extrapolating in this direction is not significant (such as US bonds and gold) unless it can be fully proven that there is a risk of deep recession, and the economy may be repaired again after the Fed's interest rate cut, and consideration should be given to assets that may benefit after the rate cut. Moreover, the expectations included in different assets also affect the reaction to the rate cut itself. We estimate that the current degree of expected interest rate cuts is as follows: interest rate futures (225bp) > gold (83bp) > copper (77bp) > US bonds (75bp) > US stocks (29bp), which is also the reason why US stocks and copper rebounded more clearly than gold at the end of August ("How much is expected to be included in various assets for interest rate cuts?") and is the main meaning of our suggestion to "think and act in reverse" ("New Thinking for Interest Rate Trading").

For US stocks, our financial liquidity model estimates that improvement is expected after the fourth quarter, which also coincides with the intensive events in the next one to two months, such as the second debate of the US presidential election (September 11th in the morning Beijing time, also the first debate of Harris and Trump and the final debate of this round of elections), US inflation data (September 11th in the evening), and the September FOMC meeting (September 19th). Therefore, short-term fluctuations are also normal, but the dip is actually a better opportunity for allocation.

This article is reproduced from Kevin Strategy Research, edited by Zhītōng Finance: Chen Wenfang.
