

Source: Zhongjin Dim Sum
Authors: CICC Asset Research: Li Zhao, Yang Xiaoqing, Qu Botao
What is the US economy really like? ——A panoramic economic tracking framework
The key disagreement in the current global market is whether the US economy will decline. Since economic data is strong and weak, pessimists focus on weak data, optimists focus on strong data, and each uses data to support their own arguments, making it difficult to reach consensus. In order to confirm the actual situation of the US economy, we need to separate priorities, ignore noise, and conduct comprehensive analysis. We have proposed a panoramic tracking framework for the US economy, which groups more than 70 common US economic data indicators into core indicators, auxiliary indicators, and outlook (high frequency) indicators, and separately tracks and scores the 6 fields of overall, consumption, investment, real estate, credit, and employment, providing a comprehensive and prioritized tracking framework.
Core indicators are the most critical indicators for judging the state of the economic sector, and have a definitive effect, such as actual personal consumption, total fixed assets, etc. When other indicators disagree with the core indicators, the signals of the core indicators should generally be used. The disadvantages of core indicators are that the number of indicators is small, the information is partial overall, the granularity is poor, and sometimes there is lag or even systemic bias, so other indicators are also required to supplement correction or provide predictions.
 Auxiliary indicators are divided into 2 categories. The first category provides internal structural information for total indicators. For example, in employment data, non-agricultural employment (total employment) is the core indicator, and full-time employment and part-time employment are auxiliary indicators. Another category is related indicators that are less important than core indicators, such as job vacancy rate and permanent unemployment rate in employment data. Forward-looking indicators are indicators that are leading or more frequent (can be updated weekly or daily) with a higher frequency of core indicators. For example, in the case of investments, capital expenditure plans are forward-looking indicators. As far as consumption is concerned, residents' income and consumer expectations are forward-looking indicators.
Three types of indicators are used to calculate short-term changes, medium-term trends, and cycle positions in these six economic sectors, and provide comprehensive scores. We found that the core indicators of consumption are healthy, and the forward-looking indicators have not weakened significantly; the core indicators of investment data are healthy, but the forward-looking indicators have cooled down; the core indicators of real estate are diverging, and the core indicators of credit and employment have cooled down markedly.
Chart: A Panoramic Framework for Analyzing the US Economy
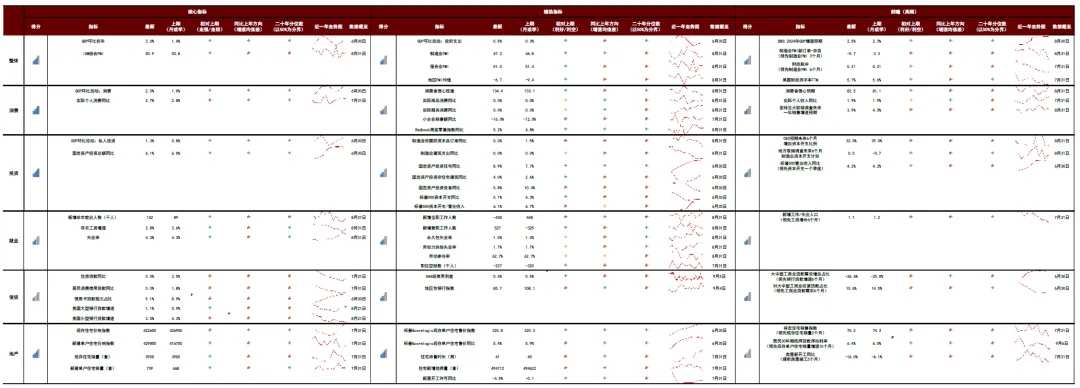
Note: The comprehensive score calculation method is: current data - previous period data, last three months (quarter) average - previous year's three-month (quarter) average, and quantile levels for the past 20 years are given 20%, 40%, and 40%, respectively. The score is based on the number of upward indicators/total number of indicators
In summary, consumption > investment > real estate > employment > credit. We believe that the US economy is only cooling down; it has not yet fallen into recession; some sectors of the economy suggest downside risks.
Although the economy may not necessarily decline, recession trading is still worth participating in
At this point, in fact, the probability of a soft landing and a hard landing in the US is not low. We think the recession deal is still worth participating in. There are two aspects to consider:
First, the market has underestimated the risk of recession, providing opportunities for reverse trading. Looking at this year's popular opinions, whether they expect the Federal Reserve to cut interest rates lightly, be preventive, or bullish on US stocks, copper, or oil, or expect overseas interest rates to be “higher for longer,” they are all based on the strong assumption that “the US economy will not recede.” When popular perception clearly underestimates the risk of a US recession, we have always predicted that the Federal Reserve will cut interest rates earlier and deeper (rather than shallow interest rate cuts and slow interest rate cuts), overfitting safe assets represented by US debt and gold (not risky assets such as copper and oil), which suggests the risk of global stock fluctuations. Recent adjustments in market expectations and asset performance are in line with our predictions.
Second, the logic of recessionary transactions is difficult to falsify in the short term. Although the US economy is currently running well, it has been confirmed that the economic cycle is declining under the triple pressure of US residents' excess savings being exhausted, pressure on high interest rates gradually showing, and gradual decline in financial support. In the future, more data may suggest downward pressure on the economy and end the current situation of data fragmentation.
Chart: The San Francisco Federal Reserve estimates that US residents' excess savings have been exhausted
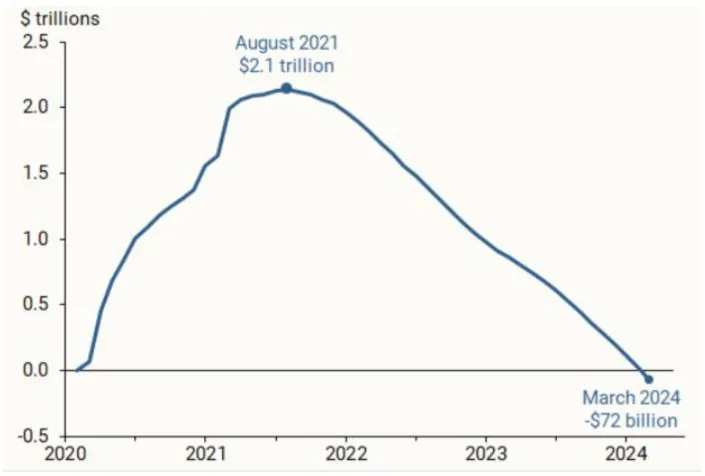
Chart: Under high interest rates, residents' demand for housing credit is under pressure
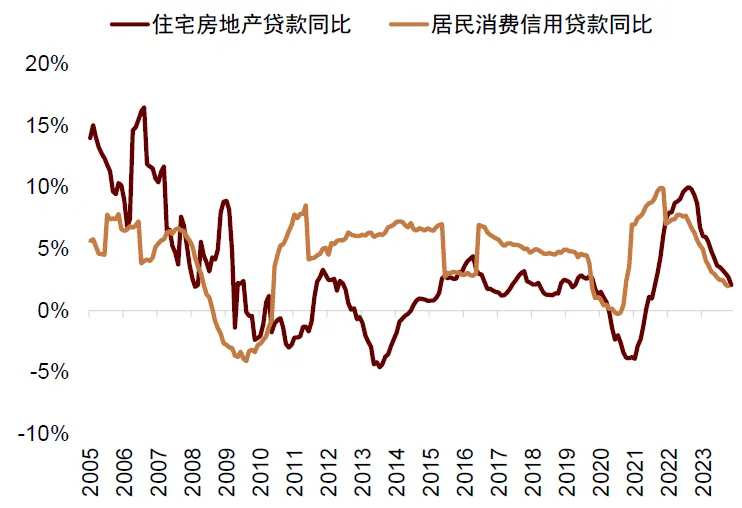
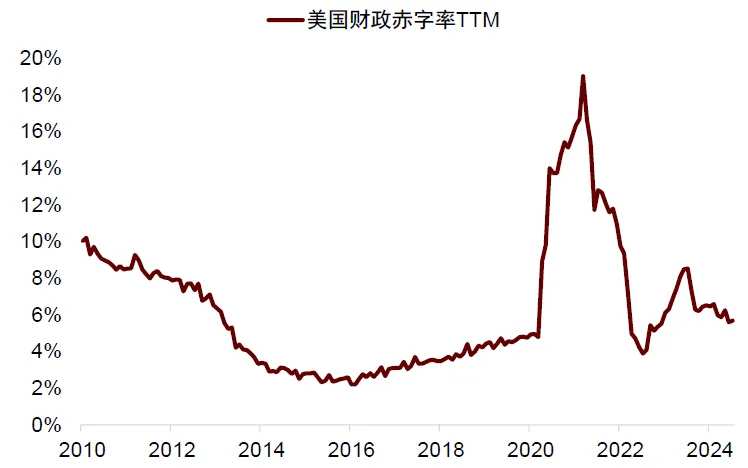
Chart: The rolling deficit rate of the US has continued to decline over the past 12 months
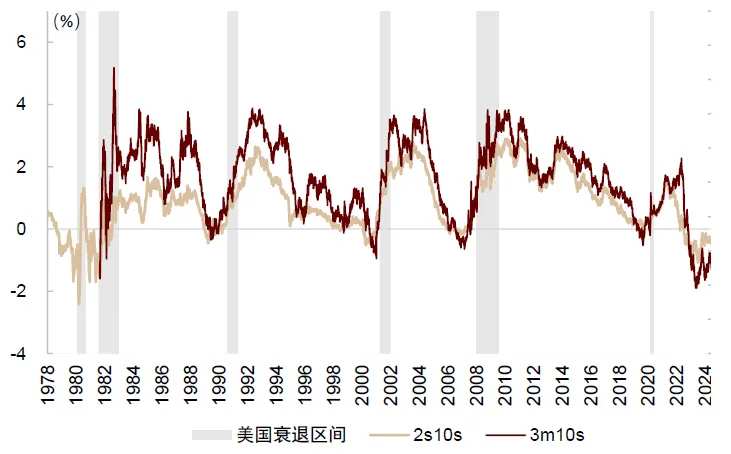
Judging from the rules of historical review, the US basically fell into recession under a macroeconomic environment similar to the current one: the Federal Reserve's aggressive interest rate hikes against the backdrop of high oil prices and high inflation all ended in recession. After the US debt curve continued to be deeply inverted over the past 50 years, the US economy fell into recession without exception.
Chart: After the Federal Reserve raised interest rates against the backdrop of high inflation and high oil prices, the US economy has all fallen into recession for the past 50 years

Chart: After interest rates on US bonds have been inverted in the past 50 years, the US economy has all fallen into recession
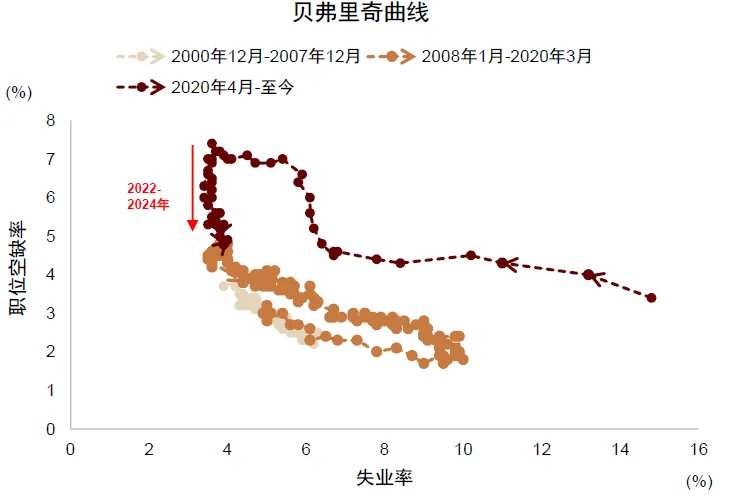
Every time the Sam rule has been triggered in the past 50 years, the economy has fallen into recession without exception. The rise in the US unemployment rate exceeded expectations in July triggered Sam's rule. Although the unemployment rate declined somewhat in August, the Beveridge curve suggests that there is a risk that the US unemployment rate will rise nonlinearly: the past year showed a vertical Beveridge curve and Phillips curve, largely because the economy is in a “full employment” state and the unemployment rate has remained stable. According to historical empirical rules, the Beveridge curve has fallen to an inflection point of slope change, reflecting the rising risk that the economy is switching to a state of “underemployment” and that the unemployment rate is rising at an accelerated pace. Although we can use “this time is different” to defend the special nature of this cycle, in fact, every cycle has its own special features, and the winning rate of betting on “this time is not the same” has not been high in history.
Chart: The upward cycle of the unemployment rate has nonlinear characteristics

Chart: The Beveridge curve suggests there is a risk that the US unemployment rate will rise nonlinearly
Interest rate cut deals have a higher win rate than recession deals, using short-term fluctuations in September to increase allocation
Although recession trading is worth participating in, after all, uncertainty is high. Is there a more definitive trading direction? We think interest rate cut deals are more certain. There are two possibilities for the future:
1) The US economy fell into recession, and the Federal Reserve was forced to cut interest rates sharply to deal with economic difficulties.
2) Thanks to the decisive interest rate cut by the Federal Reserve, the economy escaped a disaster and successfully achieved a soft landing.
Whether the US economy eventually declines or not, it may cause the Federal Reserve to cut interest rates earlier and by a deeper margin rather than a “shallow interest rate cut.” We previously suggested that starting interest rate cuts in September is the benchmark scenario, and we do not rule out the possibility of cutting interest rates by 50 bps or holding an interim meeting to cut interest rates early; it has become a market consensus. We maintain our previous judgment that if we are unwilling to participate in recession transactions, then interest rate cut transactions may be an excellent hedge against recession risks.
Against the backdrop of a slowing economic outlook, the biggest obstacle to the Fed's interest rate cut is the risk of rising inflation, but our inflation forecasting model shows that there is no risk of “secondary inflation” in the second half of the year (see inflation forecast later), which already relieves worries about interest rate cuts.
The Federal Reserve's earlier and deeper interest rate cuts will open up new room for growth in the performance of assets such as US bonds and gold. According to the “interest rate expectation+term premium” framework, the medium- to long-term equilibrium price of interest rates on ten-year US Treasury bonds is around 3.5% (”Has the US entered an era of high interest rates?”). Gold not only benefits from the three cyclical factors of recession risk, interest rate cut transactions, and election transactions (“European and American Elections and Asset Variables》) It is also supported by structural factors such as anti-globalization and de-dollarization.
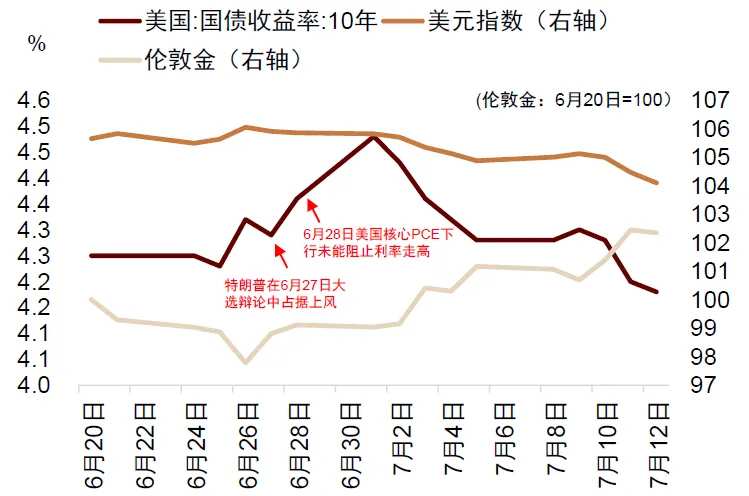
Chart: Mid-year election deals push up interest rates on US bonds, and gold continues to rise
At the same time, we also suggest that overseas market variables will increase in September. The second candidate debate for the September 11 US election will soon be held, the Federal Reserve FOMC meeting will soon begin the interest rate cut cycle on September 19, and the Bank of Japan will announce the latest interest rate decision on September 20. The market is concerned about the prospects for the Bank of Japan to raise interest rates in the fourth quarter. Faced with many uncertainties, fluctuations in global assets are likely to increase in September. If US debt and gold recover, it is recommended to take the opportunity to increase allocations at low times.
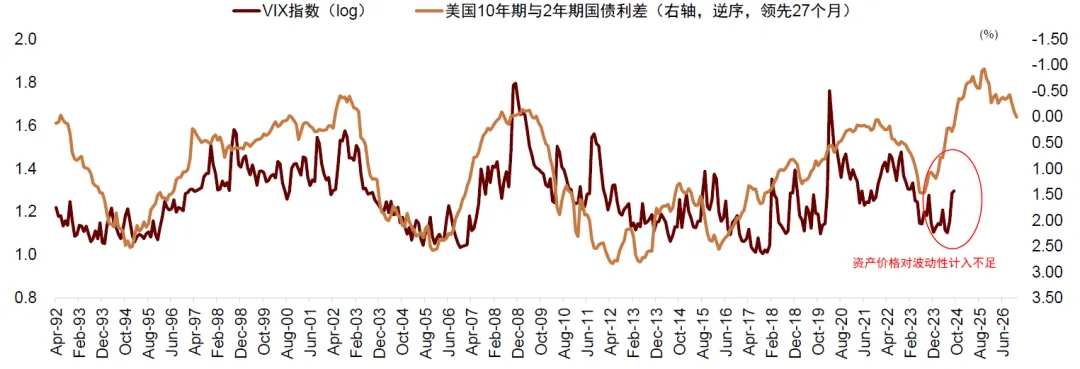
Regarding risky assets, overseas stock markets often fell in the early stages of successive recessions, and interest rate cuts were difficult to hedge against recessionary pressure. Against the backdrop of increased market variables in September, overseas stock markets may still not price risk enough. It is recommended to be neutral and cautious about overseas stocks and wait patiently for the Federal Reserve's policy support before increasing the layout.
Chart: The VIX Index is at a cyclical low level, and overseas assets seriously underprice risk
Commodity trends are more affected by the economic cycle than the “supercycle”. Global economic growth and demand are weakening, and inventories are not tight. Trump advocates increasing oil and gas supply and opposing the green transition. Considering that Trump's current approval rating is very close to Harris [1], if Trump's approval rating rises further in September and election deals make a comeback, it may be bad for commodities. Taking into account risks and benefits, we will maintain low-grade copper and oil products for the time being.
Chart: Commodity prices are closely linked to global economic cycles
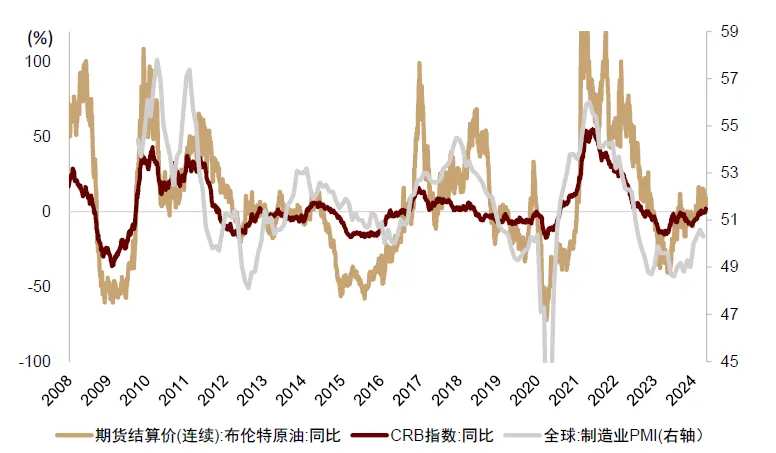
Chart: Current global copper inventories are high compared to the same period in previous years
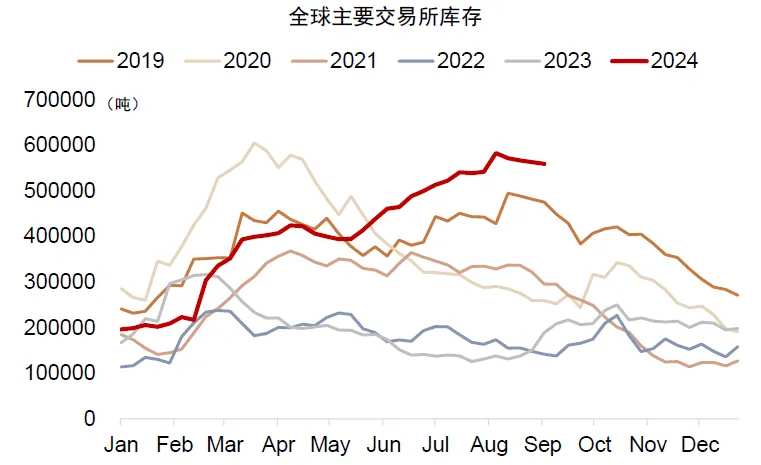
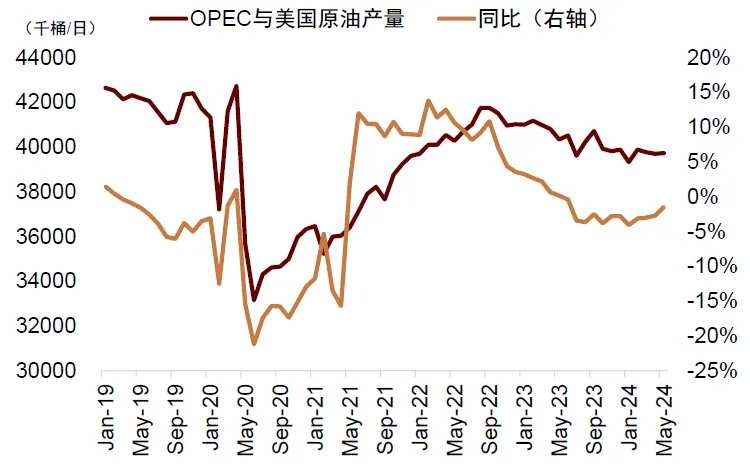
Chart: OPEC and US crude oil supply have not declined significantly
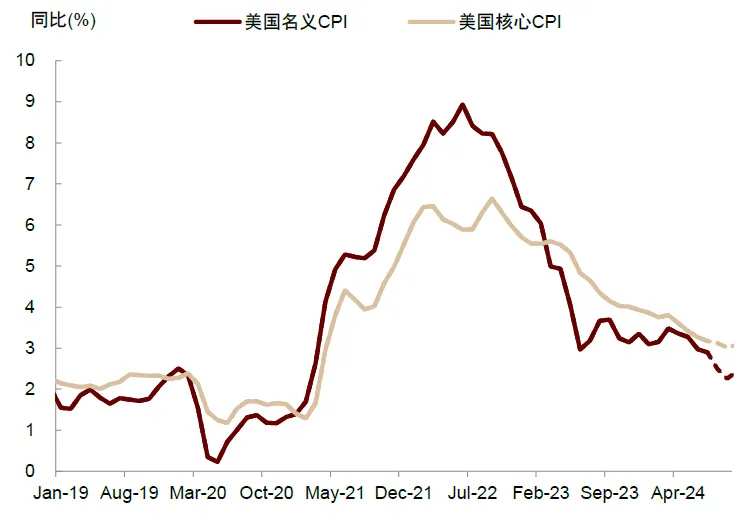
US inflation is likely to continue to be low in August, and the risk of second inflation in the second half of the year is low
The US CPI for August will be announced on September 11th (Wednesday). The CICC asset class model predicts US nominal CPI of 0.14% month-on-month (agreed forecast 0.2%, previous value 0.15%) and core CPI 0.18% month-on-month (consistent forecast 0.2%, previous value 0.17%).
Chart: US nominal CPI month-on-month growth rate split and forecast
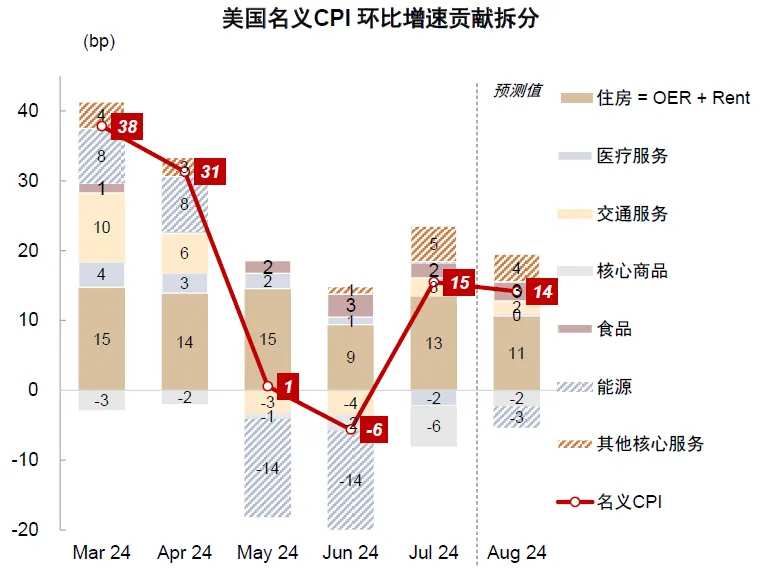
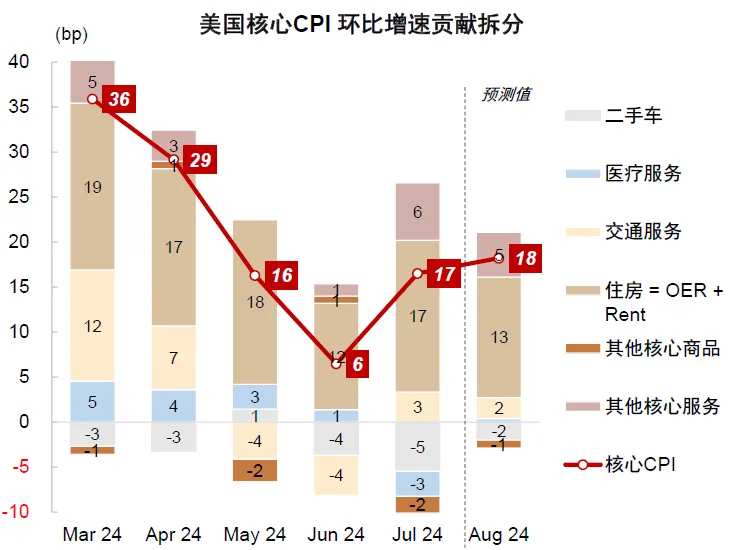
Chart: Breakdown and forecast of the month-on-month growth rate of the US core CPI
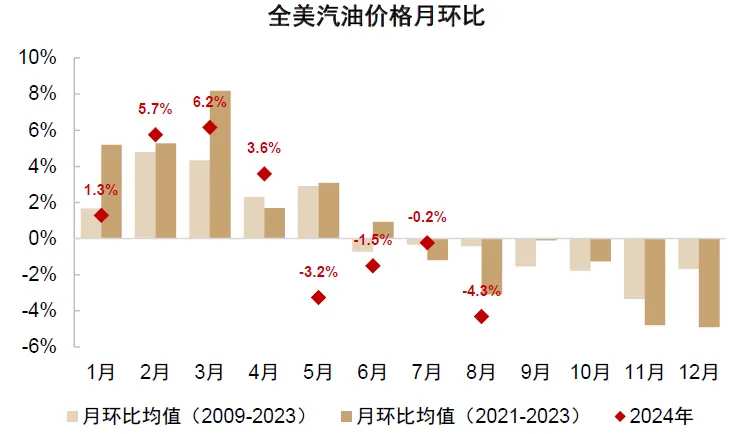
The negative month-on-month change in nominal CPI was mainly due to the excessive seasonal decline in energy prices.
Chart: Gasoline prices fell unseasonally in August
The core CPI is still in the 20 bp range, affected by two factors: high-frequency data shows that used cars continued to fall month-on-month, rent inflation rose markedly last month due to sample rotation effects, and the growth rate may have slowed relatively this month.
Chart: Used car wholesale prices lead used car inflation
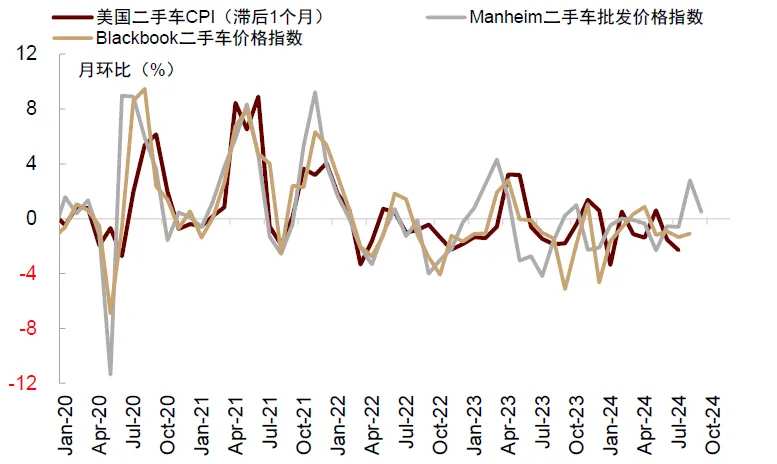
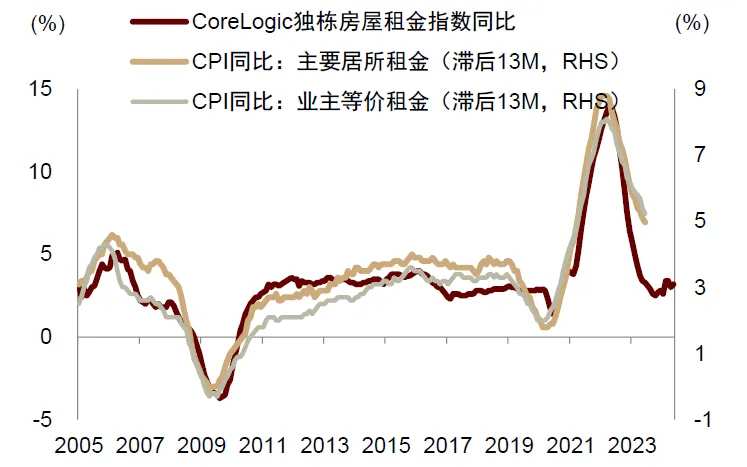
Chart: Rents in the US market stopped falling and stabilized, but rent inflation is still on a downward trajectory
Using the month-on-month forecast to derive the year-on-year growth rate, we predict that the nominal CPI will drop sharply to 2.5% year on year in August, and the core CPI will drop to 3.1% year on year.
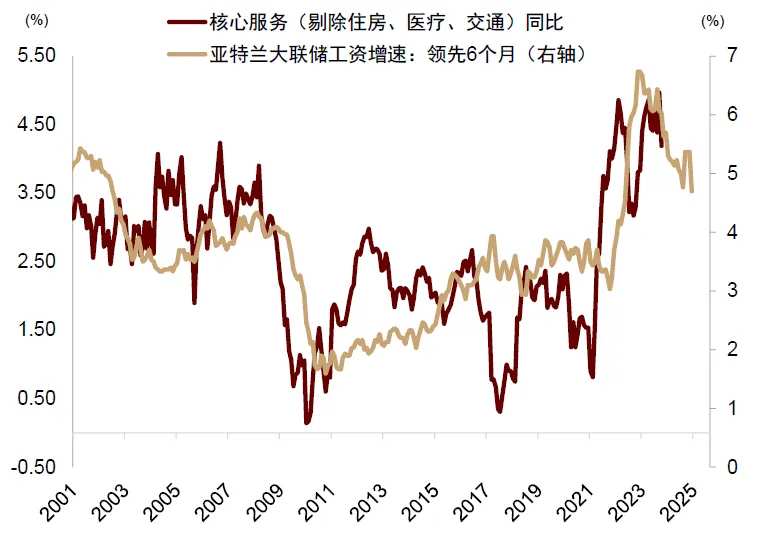
Looking ahead for 1-2 quarters, we expect US inflation to continue its downward trend: rent inflation may accelerate downward under the influence of lagging effects and become a ballast stone for improving inflation; supply chain pressure will ease to reduce inflation in core commodities; and the labor market will cool down drastically, helping inflation in other core services continue to improve.
Chart: The model predicts that US rent inflation is still expected to improve
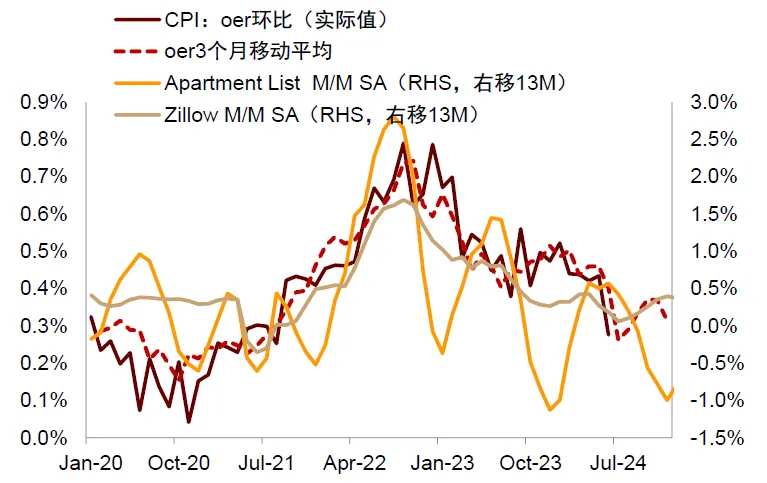
Chart: Relieving supply chain pressure helps keep US core commodity inflation low
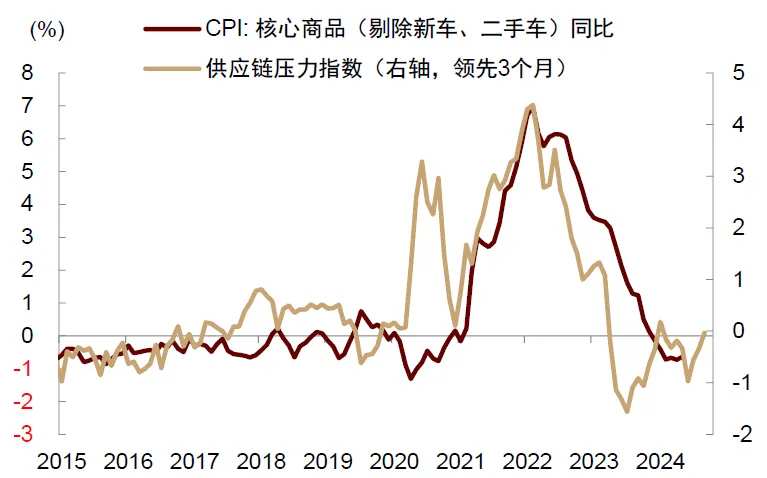
Chart: The cooling labor market is conducive to improving inflation in US core services
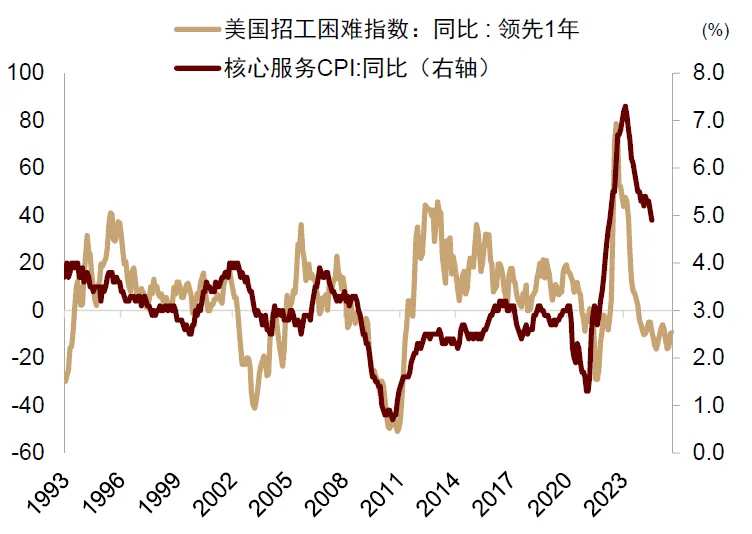
Chart: Wage cooling is a leading indicator of declining core inflation
The increase in abnormal inflation data this year has increased the probability that the monthly statistical forecast will be wrong, but the impact on forecasting inflation trends is limited. The CICC asset inflation segmentation forecast model shows that as long as there is no black swan incident, CPI inflation is likely to remain in the 2.5%-3% range this year, PCE remains in the 2%-2.5% range, and the risk of secondary inflation in the second half of the year is low, relieving worries about the Fed cutting interest rates.
Chart: The risk of second US inflation in the second half of the year is low
Appendix
Chart: US consumption growth is still normal
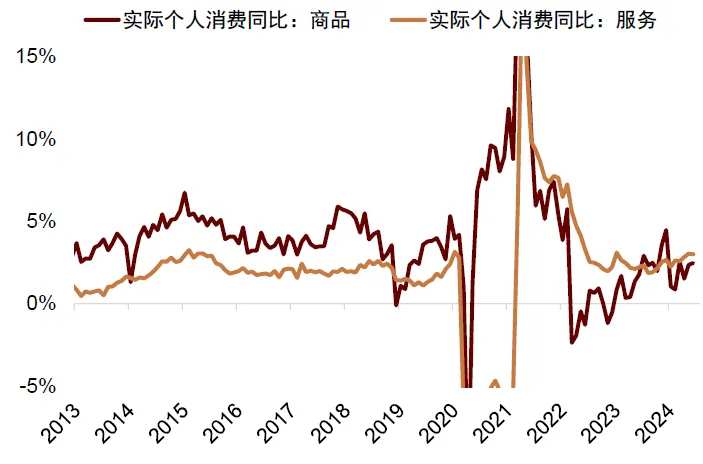
Chart: Forward-looking indicators have not cooled down significantly
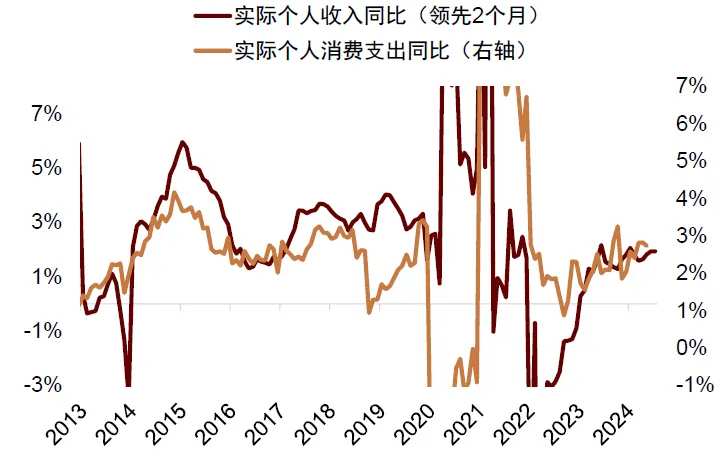
Chart: The growth rate of fixed asset investment is relatively healthy
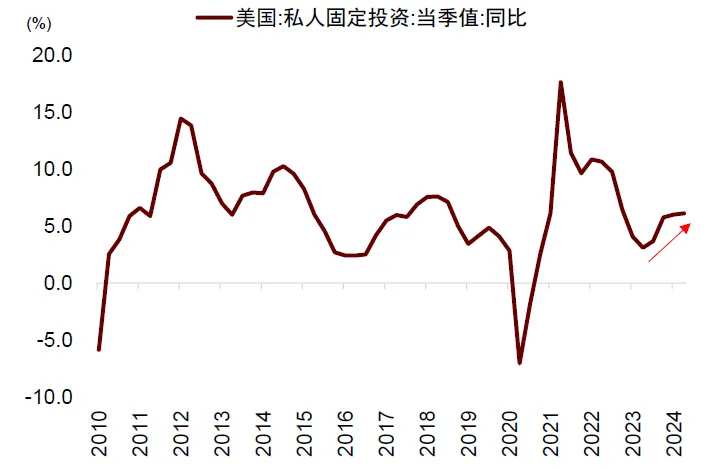
Chart: Forward-looking indicators show signs of investment cooling
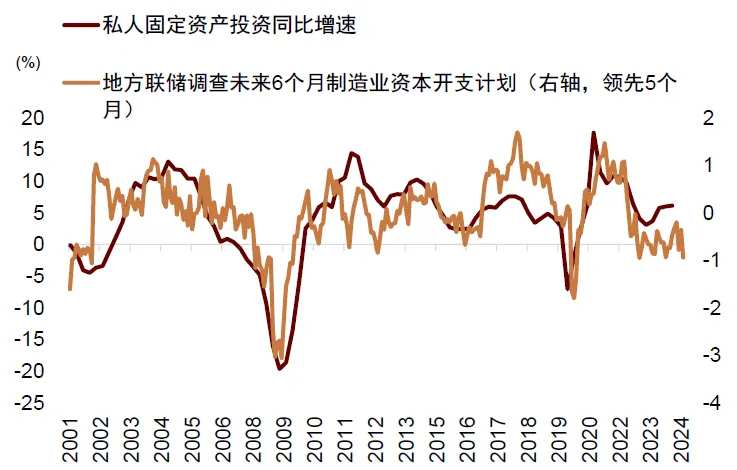
Chart: Real estate sales fluctuate at a low level
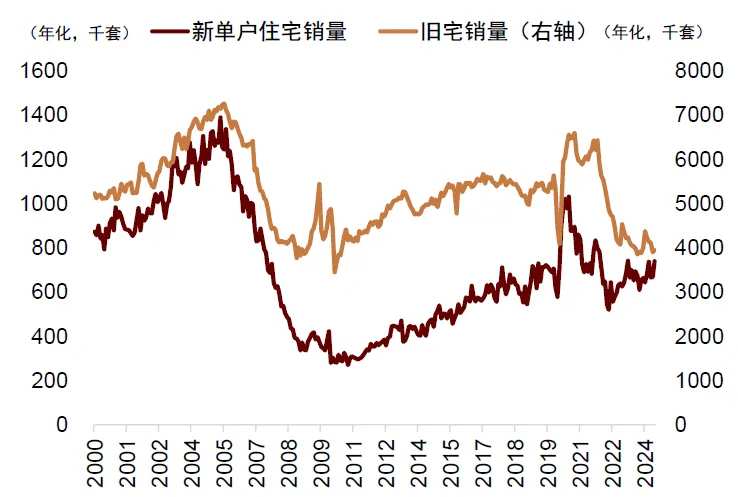
Chart: However, real estate prices fluctuated at high levels, and indicators of different caliber diverged
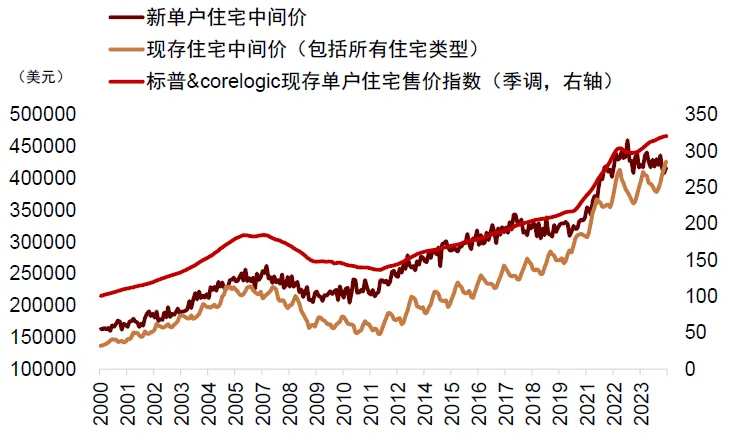
Chart: Non-farm payrolls continue to decline
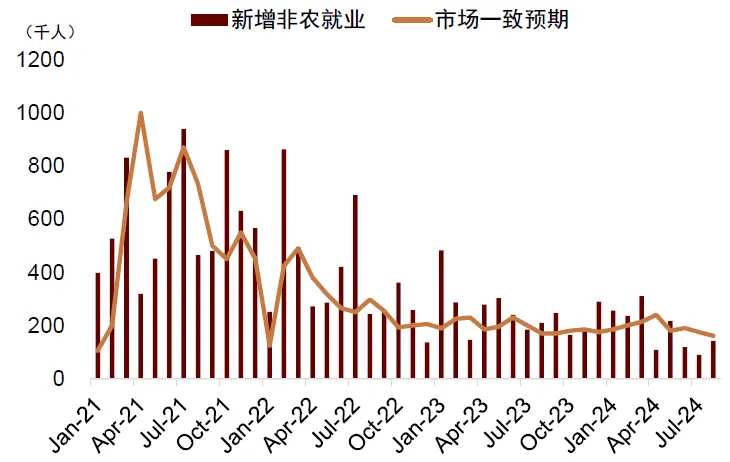
Chart: Sam's rule has been triggered since July
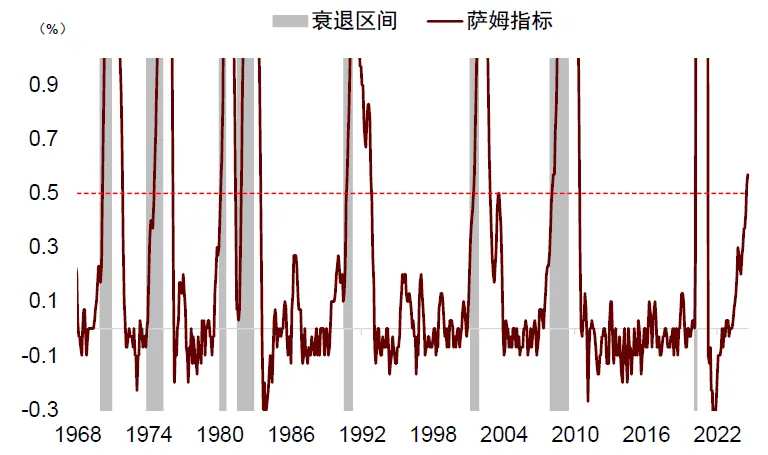
Chart: The growth rate of US loans is declining, and there has recently been a slight rebound
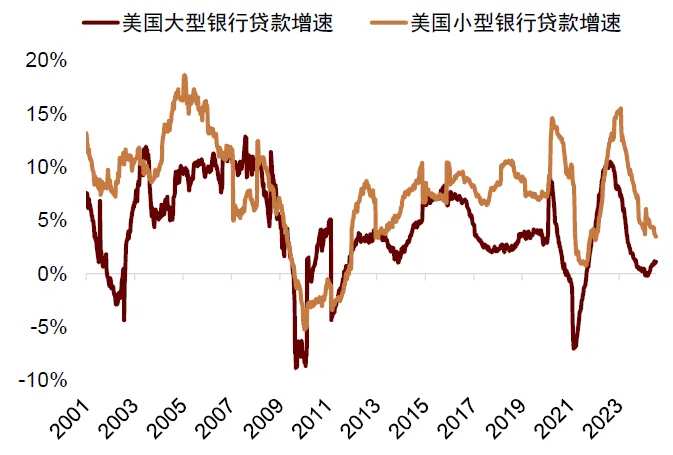
Chart: Demand for loans is still low
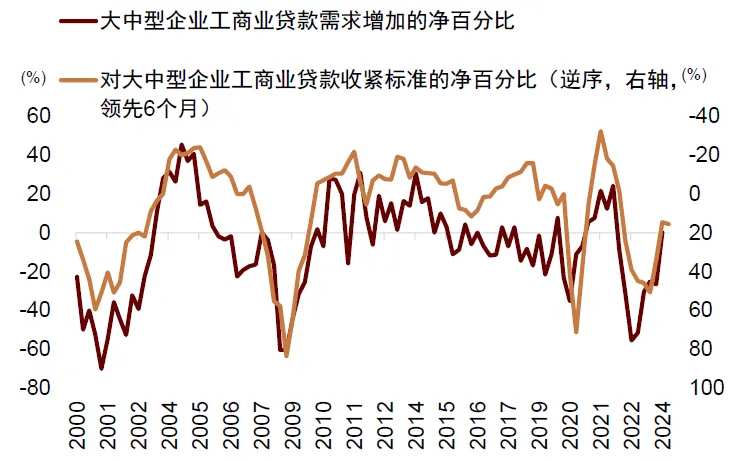
Chart: Forward-looking indicators suggest that manufacturing PMI may decline further
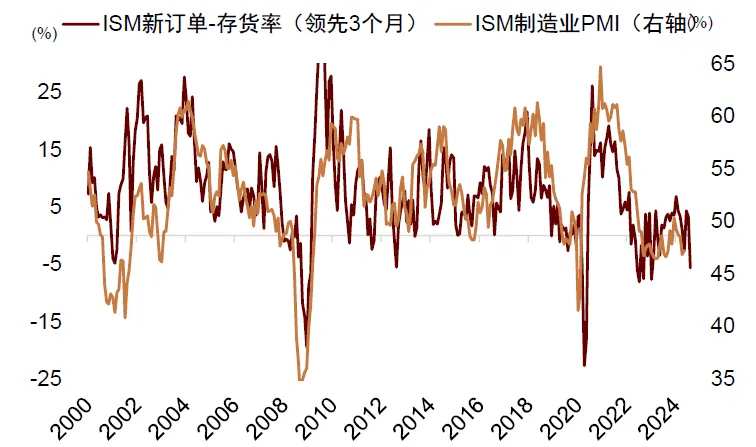
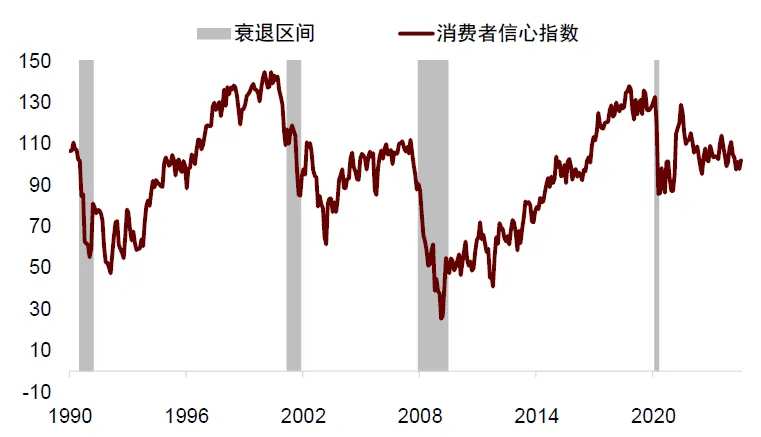
Chart: Consumer confidence levels are close to levels during previous recessions
[1] https://www.forbes.com/sites/saradorn/2024/09/08/trump-vs-harris-2024-polls-harris-leads-by-2-points-in-latest-survey/
Editor/jayden
