
When you buy and hold a stock for the long term, you definitely want it to provide a positive return. But more than that, you probably want to see it rise more than the market average. But Choice Hotels International, Inc. (NYSE:CHH) has fallen short of that second goal, with a share price rise of 32% over five years, which is below the market return. The last year has been disappointing, with the stock price down 4.1% in that time.
Although Choice Hotels International has shed US$220m from its market cap this week, let's take a look at its longer term fundamental trends and see if they've driven returns.
To paraphrase Benjamin Graham: Over the short term the market is a voting machine, but over the long term it's a weighing machine. One way to examine how market sentiment has changed over time is to look at the interaction between a company's share price and its earnings per share (EPS).
During five years of share price growth, Choice Hotels International achieved compound earnings per share (EPS) growth of 5.6% per year. This EPS growth is remarkably close to the 6% average annual increase in the share price. Therefore one could conclude that sentiment towards the shares hasn't morphed very much. In fact, the share price seems to largely reflect the EPS growth.
The graphic below depicts how EPS has changed over time (unveil the exact values by clicking on the image).
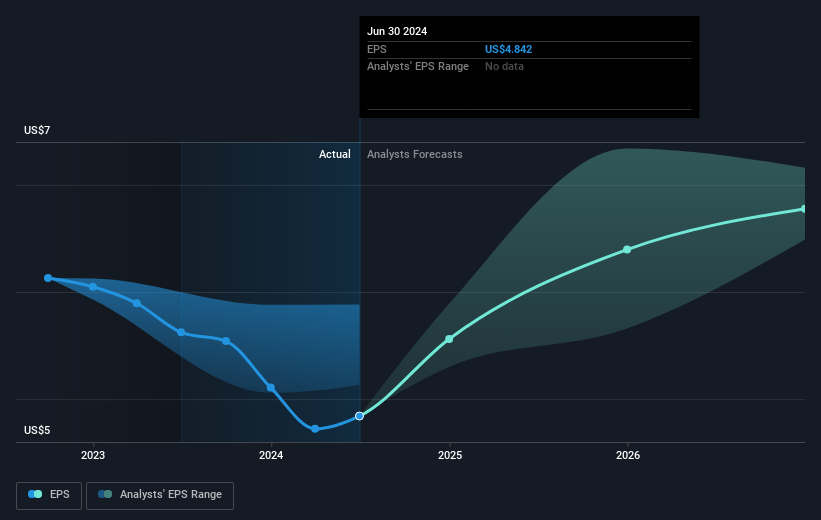
It might be well worthwhile taking a look at our free report on Choice Hotels International's earnings, revenue and cash flow.
What About Dividends?
When looking at investment returns, it is important to consider the difference between total shareholder return (TSR) and share price return. The TSR is a return calculation that accounts for the value of cash dividends (assuming that any dividend received was reinvested) and the calculated value of any discounted capital raisings and spin-offs. Arguably, the TSR gives a more comprehensive picture of the return generated by a stock. We note that for Choice Hotels International the TSR over the last 5 years was 37%, which is better than the share price return mentioned above. And there's no prize for guessing that the dividend payments largely explain the divergence!
A Different Perspective
Investors in Choice Hotels International had a tough year, with a total loss of 3.2% (including dividends), against a market gain of about 21%. Even the share prices of good stocks drop sometimes, but we want to see improvements in the fundamental metrics of a business, before getting too interested. On the bright side, long term shareholders have made money, with a gain of 7% per year over half a decade. It could be that the recent sell-off is an opportunity, so it may be worth checking the fundamental data for signs of a long term growth trend. I find it very interesting to look at share price over the long term as a proxy for business performance. But to truly gain insight, we need to consider other information, too. Take risks, for example - Choice Hotels International has 2 warning signs (and 1 which can't be ignored) we think you should know about.
If you like to buy stocks alongside management, then you might just love this free list of companies. (Hint: many of them are unnoticed AND have attractive valuation).
Please note, the market returns quoted in this article reflect the market weighted average returns of stocks that currently trade on American exchanges.
Have feedback on this article? Concerned about the content? Get in touch with us directly. Alternatively, email editorial-team (at) simplywallst.com.
This article by Simply Wall St is general in nature. We provide commentary based on historical data and analyst forecasts only using an unbiased methodology and our articles are not intended to be financial advice. It does not constitute a recommendation to buy or sell any stock, and does not take account of your objectives, or your financial situation. We aim to bring you long-term focused analysis driven by fundamental data. Note that our analysis may not factor in the latest price-sensitive company announcements or qualitative material. Simply Wall St has no position in any stocks mentioned.