
Interface's (NASDAQ:TILE) stock is up by a considerable 23% over the past three months. Given that the market rewards strong financials in the long-term, we wonder if that is the case in this instance. Specifically, we decided to study Interface's ROE in this article.
Return on Equity or ROE is a test of how effectively a company is growing its value and managing investors' money. In simpler terms, it measures the profitability of a company in relation to shareholder's equity.
How Is ROE Calculated?
The formula for return on equity is:
Return on Equity = Net Profit (from continuing operations) ÷ Shareholders' Equity
So, based on the above formula, the ROE for Interface is:
15% = US$66m ÷ US$451m (Based on the trailing twelve months to June 2024).
The 'return' is the amount earned after tax over the last twelve months. Another way to think of that is that for every $1 worth of equity, the company was able to earn $0.15 in profit.
What Has ROE Got To Do With Earnings Growth?
So far, we've learned that ROE is a measure of a company's profitability. Based on how much of its profits the company chooses to reinvest or "retain", we are then able to evaluate a company's future ability to generate profits. Assuming everything else remains unchanged, the higher the ROE and profit retention, the higher the growth rate of a company compared to companies that don't necessarily bear these characteristics.
A Side By Side comparison of Interface's Earnings Growth And 15% ROE
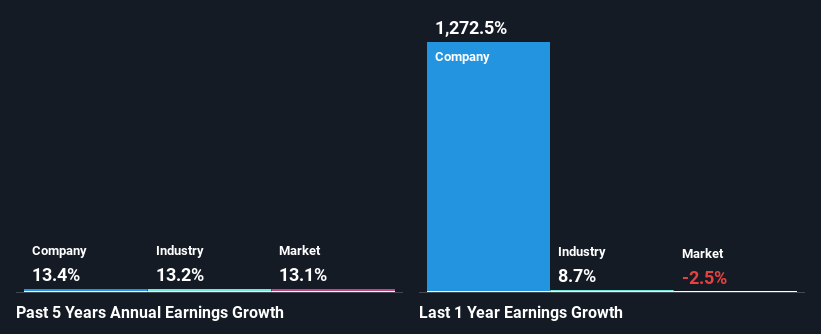
To start with, Interface's ROE looks acceptable. On comparing with the average industry ROE of 11% the company's ROE looks pretty remarkable. Probably as a result of this, Interface was able to see a decent growth of 13% over the last five years.
Next, on comparing Interface's net income growth with the industry, we found that the company's reported growth is similar to the industry average growth rate of 13% over the last few years.
Earnings growth is a huge factor in stock valuation. The investor should try to establish if the expected growth or decline in earnings, whichever the case may be, is priced in. This then helps them determine if the stock is placed for a bright or bleak future. If you're wondering about Interface's's valuation, check out this gauge of its price-to-earnings ratio, as compared to its industry.
Is Interface Efficiently Re-investing Its Profits?
Interface has a low three-year median payout ratio of 4.5%, meaning that the company retains the remaining 96% of its profits. This suggests that the management is reinvesting most of the profits to grow the business.
Besides, Interface has been paying dividends for at least ten years or more. This shows that the company is committed to sharing profits with its shareholders. Upon studying the latest analysts' consensus data, we found that the company's future payout ratio is expected to rise to 6.2% over the next three years.
Conclusion
On the whole, we feel that Interface's performance has been quite good. Particularly, we like that the company is reinvesting heavily into its business, and at a high rate of return. Unsurprisingly, this has led to an impressive earnings growth. With that said, the latest industry analyst forecasts reveal that the company's earnings are expected to accelerate. To know more about the company's future earnings growth forecasts take a look at this free report on analyst forecasts for the company to find out more.
Have feedback on this article? Concerned about the content? Get in touch with us directly. Alternatively, email editorial-team (at) simplywallst.com.
This article by Simply Wall St is general in nature. We provide commentary based on historical data and analyst forecasts only using an unbiased methodology and our articles are not intended to be financial advice. It does not constitute a recommendation to buy or sell any stock, and does not take account of your objectives, or your financial situation. We aim to bring you long-term focused analysis driven by fundamental data. Note that our analysis may not factor in the latest price-sensitive company announcements or qualitative material. Simply Wall St has no position in any stocks mentioned.