
Most readers would already be aware that Ferrari's (NYSE:RACE) stock increased significantly by 14% over the past three months. Given that the market rewards strong financials in the long-term, we wonder if that is the case in this instance. Particularly, we will be paying attention to Ferrari's ROE today.
Return on equity or ROE is an important factor to be considered by a shareholder because it tells them how effectively their capital is being reinvested. In short, ROE shows the profit each dollar generates with respect to its shareholder investments.
How Is ROE Calculated?
The formula for return on equity is:
Return on Equity = Net Profit (from continuing operations) ÷ Shareholders' Equity
So, based on the above formula, the ROE for Ferrari is:
45% = €1.4b ÷ €3.1b (Based on the trailing twelve months to June 2024).
The 'return' is the profit over the last twelve months. So, this means that for every $1 of its shareholder's investments, the company generates a profit of $0.45.
What Has ROE Got To Do With Earnings Growth?
We have already established that ROE serves as an efficient profit-generating gauge for a company's future earnings. Depending on how much of these profits the company reinvests or "retains", and how effectively it does so, we are then able to assess a company's earnings growth potential. Assuming everything else remains unchanged, the higher the ROE and profit retention, the higher the growth rate of a company compared to companies that don't necessarily bear these characteristics.
A Side By Side comparison of Ferrari's Earnings Growth And 45% ROE
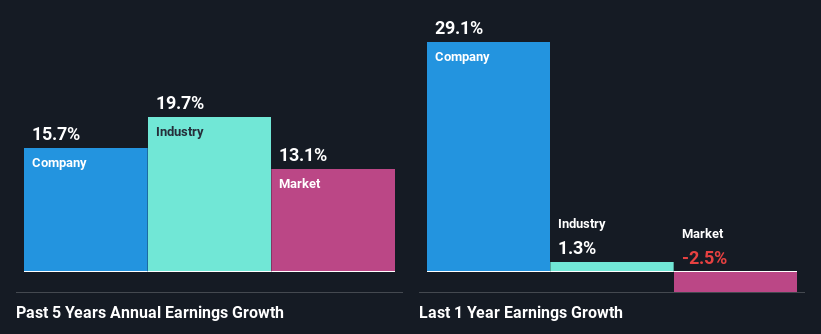
To begin with, Ferrari has a pretty high ROE which is interesting. Secondly, even when compared to the industry average of 16% the company's ROE is quite impressive. Probably as a result of this, Ferrari was able to see a decent net income growth of 16% over the last five years.
As a next step, we compared Ferrari's net income growth with the industry and were disappointed to see that the company's growth is lower than the industry average growth of 20% in the same period.
Earnings growth is an important metric to consider when valuing a stock. It's important for an investor to know whether the market has priced in the company's expected earnings growth (or decline). By doing so, they will have an idea if the stock is headed into clear blue waters or if swampy waters await. One good indicator of expected earnings growth is the P/E ratio which determines the price the market is willing to pay for a stock based on its earnings prospects. So, you may want to check if Ferrari is trading on a high P/E or a low P/E, relative to its industry.
Is Ferrari Making Efficient Use Of Its Profits?
Ferrari has a three-year median payout ratio of 30%, which implies that it retains the remaining 70% of its profits. This suggests that its dividend is well covered, and given the decent growth seen by the company, it looks like management is reinvesting its earnings efficiently.
Moreover, Ferrari is determined to keep sharing its profits with shareholders which we infer from its long history of nine years of paying a dividend. Based on the latest analysts' estimates, we found that the company's future payout ratio over the next three years is expected to hold steady at 32%. Still, forecasts suggest that Ferrari's future ROE will drop to 34% even though the the company's payout ratio is not expected to change by much.
Summary
In total, we are pretty happy with Ferrari's performance. In particular, it's great to see that the company is investing heavily into its business and along with a high rate of return, that has resulted in a respectable growth in its earnings. With that said, the latest industry analyst forecasts reveal that the company's earnings growth is expected to slow down. To know more about the latest analysts predictions for the company, check out this visualization of analyst forecasts for the company.
Have feedback on this article? Concerned about the content? Get in touch with us directly. Alternatively, email editorial-team (at) simplywallst.com.
This article by Simply Wall St is general in nature. We provide commentary based on historical data and analyst forecasts only using an unbiased methodology and our articles are not intended to be financial advice. It does not constitute a recommendation to buy or sell any stock, and does not take account of your objectives, or your financial situation. We aim to bring you long-term focused analysis driven by fundamental data. Note that our analysis may not factor in the latest price-sensitive company announcements or qualitative material. Simply Wall St has no position in any stocks mentioned.