
To gain an edge, this is what you need to know today.
Critical Waller Remarks Ahead
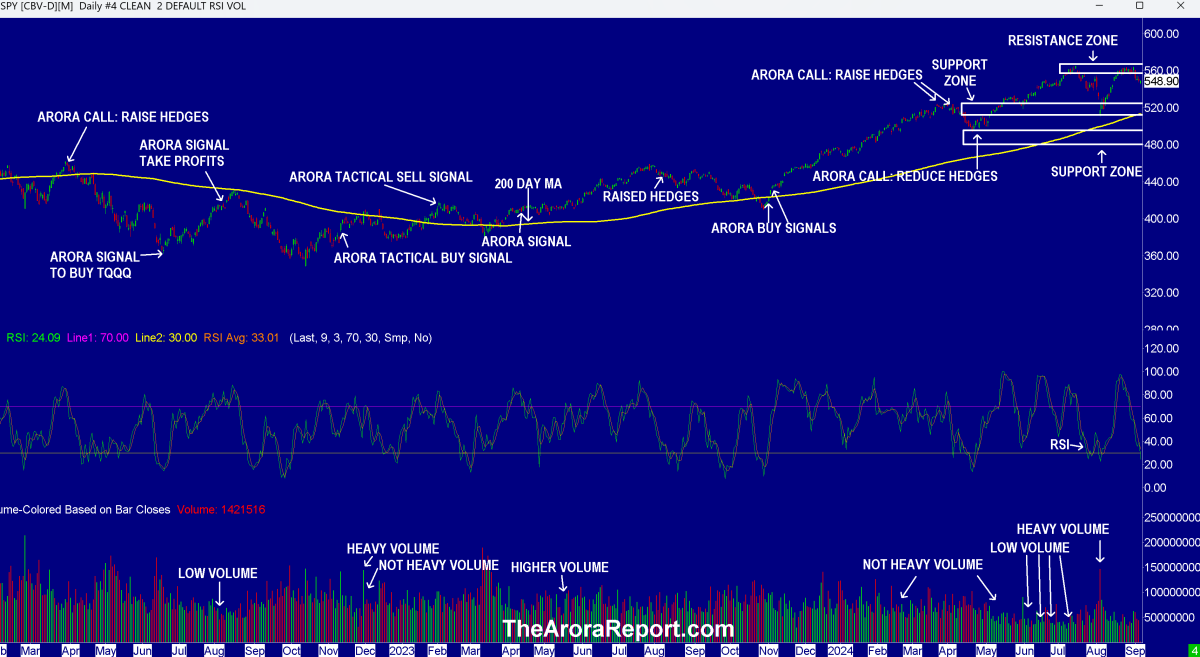
Please click here for an enlarged chart ofSPDR S&P 500 ETF Trust(NYSE:SPY) which represents the benchmark stock market index S&P 500 (SPX).
Note the following:
- The chart shows that the stock market formed a double top inside the resistance zone and was unable to penetrate the resistance zone. From a technical perspective, this is a negative.
- The chart shows that the stock market has fallen below the resistance zone.
- RSI on the chart shows that the stock market is oversold. Oversold...
Login or create a forever free account to read this news
Sign up/Log in