
Key Insights
- Significantly high institutional ownership implies Eaton's stock price is sensitive to their trading actions
- A total of 21 investors have a majority stake in the company with 50% ownership
- Insiders have been buying lately
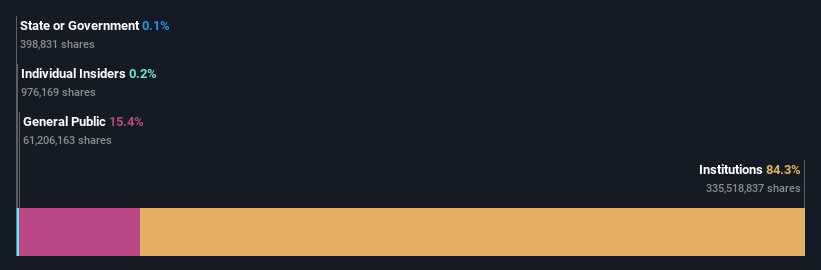
Every investor in Eaton Corporation plc (NYSE:ETN) should be aware of the most powerful shareholder groups. With 84% stake, institutions possess the maximum shares in the company. Put another way, the group faces the maximum upside potential (or downside risk).
Losing money on investments is something no shareholder enjoys, least of all institutional investors who saw their holdings value drop by 6.9% last week. However, the 23% one-year return to shareholders may have helped lessen their pain. But they would probably be wary of future losses.
In the chart below, we zoom in on the different ownership groups of Eaton.
What Does The Institutional Ownership Tell Us About Eaton?
 Institutions typically measure themselves against a benchmark when reporting to their own investors, so they often become more enthusiastic about a stock once it's included in a major index. We would expect most companies to have some institutions on the register, especially if they are growing.
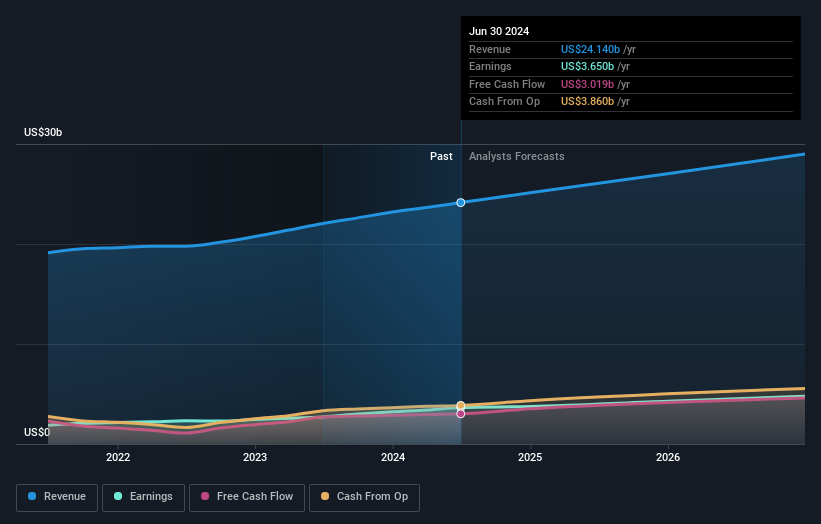
As you can see, institutional investors have a fair amount of stake in Eaton. This implies the analysts working for those institutions have looked at the stock and they like it. But just like anyone else, they could be wrong. It is not uncommon to see a big share price drop if two large institutional investors try to sell out of a stock at the same time. So it is worth checking the past earnings trajectory of Eaton, (below). Of course, keep in mind that there are other factors to consider, too.
Institutional investors own over 50% of the company, so together than can probably strongly influence board decisions. Eaton is not owned by hedge funds. The company's largest shareholder is The Vanguard Group, Inc., with ownership of 9.3%. Meanwhile, the second and third largest shareholders, hold 7.2% and 4.6%, of the shares outstanding, respectively.
Looking at the shareholder registry, we can see that 50% of the ownership is controlled by the top 21 shareholders, meaning that no single shareholder has a majority interest in the ownership.
Researching institutional ownership is a good way to gauge and filter a stock's expected performance. The same can be achieved by studying analyst sentiments. Quite a few analysts cover the stock, so you could look into forecast growth quite easily.
Insider Ownership Of Eaton
The definition of company insiders can be subjective and does vary between jurisdictions. Our data reflects individual insiders, capturing board members at the very least. The company management answer to the board and the latter should represent the interests of shareholders. Notably, sometimes top-level managers are on the board themselves.
I generally consider insider ownership to be a good thing. However, on some occasions it makes it more difficult for other shareholders to hold the board accountable for decisions.
Our most recent data indicates that insiders own less than 1% of Eaton Corporation plc. As it is a large company, we'd only expect insiders to own a small percentage of it. But it's worth noting that they own US$282m worth of shares. It is always good to see at least some insider ownership, but it might be worth checking if those insiders have been selling.
General Public Ownership
The general public-- including retail investors -- own 15% stake in the company, and hence can't easily be ignored. While this group can't necessarily call the shots, it can certainly have a real influence on how the company is run.
Next Steps:
I find it very interesting to look at who exactly owns a company. But to truly gain insight, we need to consider other information, too.
Many find it useful to take an in depth look at how a company has performed in the past. You can access this detailed graph of past earnings, revenue and cash flow.
If you would prefer discover what analysts are predicting in terms of future growth, do not miss this free report on analyst forecasts.
NB: Figures in this article are calculated using data from the last twelve months, which refer to the 12-month period ending on the last date of the month the financial statement is dated. This may not be consistent with full year annual report figures.
Have feedback on this article? Concerned about the content? Get in touch with us directly. Alternatively, email editorial-team (at) simplywallst.com.
This article by Simply Wall St is general in nature. We provide commentary based on historical data and analyst forecasts only using an unbiased methodology and our articles are not intended to be financial advice. It does not constitute a recommendation to buy or sell any stock, and does not take account of your objectives, or your financial situation. We aim to bring you long-term focused analysis driven by fundamental data. Note that our analysis may not factor in the latest price-sensitive company announcements or qualitative material. Simply Wall St has no position in any stocks mentioned.
