
 例如,由于预期就业市场降温,比特币交易所交易基金 (ETF) 每日流出资金额达到 2.878 亿美元,创下自 6 月份以来最长的流出纪录。
The risk of economic recession puts pressure on bitcoin, causing the stock price to fall.
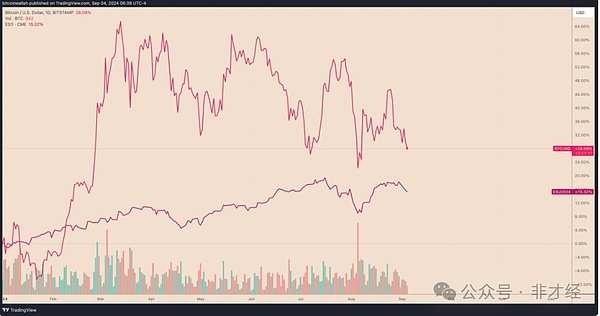
As of September 4, BTC fell by 3.30% to around $55,600, the lowest level in a month. Similarly, S&P 500 index futures fell by 0.4%, the worst performance since the market crash on August 5.
Cryptocurrency traders are waiting for key economic data to determine if the United States is approaching a recession and how the Federal Reserve will adjust its policies to prepare for further market volatility. The employment report released on September 4th may show a slowdown in the labor market, with recent data showing manufacturing activity declining for the fifth consecutive month. As concerns shift from inflation to economic growth, weak macroeconomic data puts pressure on risky assets such as stocks and cryptocurrencies.
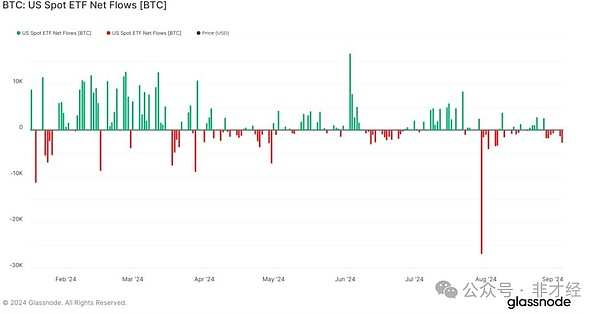
 For example, due to expectations of a cooling job market, the outflow of funds from Bitcoin exchange-traded funds (ETFs) reached $0.2878 billion, the longest outflow record since June.
Bitcoin OI and funding rate data indicate caution.
The recent decline in Bitcoin is consistent with the decrease in open interest (OI) in the futures market.
As of September 4th, the open interest in the Bitcoin futures market was approximately $30 billion, lower than the peak of $37.5 billion in July. This decline indicates that traders' confidence in the short-term price trend of Bitcoin has decreased, leading to a reduction in open futures positions.

At the same time, intraday data shows a significant drop in the funding rate of Bitcoin futures. From September 3rd to September 4th, the funding rate dropped from 0.0074% every eight hours to 0.0007% every eight hours, indicating a reduced demand for leveraged long positions.
In other words, there are fewer and fewer traders who bet on the rise in the price of bitcoin in the short term - this is another risk signal before the release of US employment data one hour ago.
The ascending wedge breakout of bitcoin is in progress.
Chart analysis shows that the loss of bitcoin on September 4th is part of the breakdown phase of the current ascending wedge pattern.
The characteristic of an ascending wedge is two converging trendlines. When the price decisively falls below the lower trendline and drops to the maximum distance between the upper and lower trendlines, the ascending wedge disappears, which represents the breakdown phase.

The downside target for the September BTC ascending wedge is around $54,000, a decrease of about 4.5% from the current price level.
Market analysis on September 6th:

The market also experienced a slight pullback last night. It dropped to around 55,770 near the low point. After reaching the low point last night, there was a slight rebound, and the market rebounded to around 56,700 to start a sideways trend. Currently, the price is running near 56,100. Looking at the four-hour chart, the Bollinger Bands are diverging and running downwards. Currently, the price is effectively stabilizing above the lower track and undergoing a sideways correction. Although there is a rebound trend in form, the momentum is weak and all candles with long upper shadows have closed down. Currently, the overall trend still shows a weak downward trend. Therefore, in this weak structure, as long as the market provides a slight rebound, it is advisable to follow the downward trend.
