
Y-mAbs Therapeutics, Inc. (NASDAQ:YMAB) shareholders would be excited to see that the share price has had a great month, posting a 33% gain and recovering from prior weakness. The last month tops off a massive increase of 195% in the last year.
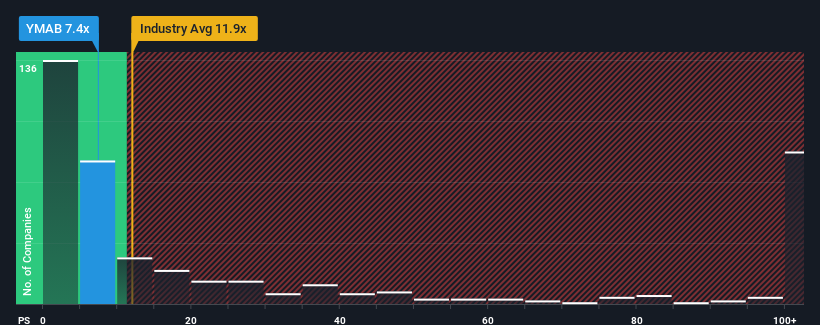
Although its price has surged higher, Y-mAbs Therapeutics may still be sending bullish signals at the moment with its price-to-sales (or "P/S") ratio of 7.4x, since almost half of all companies in the Biotechs industry in the United States have P/S ratios greater than 11.9x and even P/S higher than 77x are not unusual. Nonetheless, we'd need to dig a little deeper to determine if there is a rational basis for the reduced P/S.
How Has Y-mAbs Therapeutics Performed Recently?
Recent times haven't been great for Y-mAbs Therapeutics as its revenue has been rising slower than most other companies. The P/S ratio is probably low because investors think this lacklustre revenue performance isn't going to get any better. If you still like the company, you'd be hoping revenue doesn't get any worse and that you could pick up some stock while it's out of favour.
Want the full picture on analyst estimates for the company? Then our free report on Y-mAbs Therapeutics will help you uncover what's on the horizon.How Is Y-mAbs Therapeutics' Revenue Growth Trending?
 There's an inherent assumption that a company should underperform the industry for P/S ratios like Y-mAbs Therapeutics' to be considered reasonable.
Retrospectively, the last year delivered virtually the same number to the company's top line as the year before. Still, the latest three year period has seen an excellent 133% overall rise in revenue, in spite of its uninspiring short-term performance. Accordingly, shareholders will be pleased, but also have some questions to ponder about the last 12 months.
Turning to the outlook, the next three years should generate growth of 14% per annum as estimated by the nine analysts watching the company. With the industry predicted to deliver 138% growth per annum, the company is positioned for a weaker revenue result.
With this information, we can see why Y-mAbs Therapeutics is trading at a P/S lower than the industry. Apparently many shareholders weren't comfortable holding on while the company is potentially eyeing a less prosperous future.
The Bottom Line On Y-mAbs Therapeutics' P/S
Y-mAbs Therapeutics' stock price has surged recently, but its but its P/S still remains modest. Generally, our preference is to limit the use of the price-to-sales ratio to establishing what the market thinks about the overall health of a company.
We've established that Y-mAbs Therapeutics maintains its low P/S on the weakness of its forecast growth being lower than the wider industry, as expected. At this stage investors feel the potential for an improvement in revenue isn't great enough to justify a higher P/S ratio. Unless these conditions improve, they will continue to form a barrier for the share price around these levels.
Don't forget that there may be other risks. For instance, we've identified 4 warning signs for Y-mAbs Therapeutics (1 is significant) you should be aware of.
Of course, profitable companies with a history of great earnings growth are generally safer bets. So you may wish to see this free collection of other companies that have reasonable P/E ratios and have grown earnings strongly.
Have feedback on this article? Concerned about the content? Get in touch with us directly. Alternatively, email editorial-team (at) simplywallst.com.
This article by Simply Wall St is general in nature. We provide commentary based on historical data and analyst forecasts only using an unbiased methodology and our articles are not intended to be financial advice. It does not constitute a recommendation to buy or sell any stock, and does not take account of your objectives, or your financial situation. We aim to bring you long-term focused analysis driven by fundamental data. Note that our analysis may not factor in the latest price-sensitive company announcements or qualitative material. Simply Wall St has no position in any stocks mentioned.