
The worst result, after buying shares in a company (assuming no leverage), would be if you lose all the money you put in. But on the bright side, if you buy shares in a high quality company at the right price, you can gain well over 100%. For example, the Motorola Solutions, Inc. (NYSE:MSI) share price has soared 168% in the last half decade. Most would be very happy with that. On top of that, the share price is up 19% in about a quarter.
So let's assess the underlying fundamentals over the last 5 years and see if they've moved in lock-step with shareholder returns.
In his essay The Superinvestors of Graham-and-Doddsville Warren Buffett described how share prices do not always rationally reflect the value of a business. One imperfect but simple way to consider how the market perception of a company has shifted is to compare the change in the earnings per share (EPS) with the share price movement.
 During five years of share price growth, Motorola Solutions achieved compound earnings per share (EPS) growth of 6.9% per year. This EPS growth is slower than the share price growth of 22% per year, over the same period. This suggests that market participants hold the company in higher regard, these days. And that's hardly shocking given the track record of growth. This favorable sentiment is reflected in its (fairly optimistic) P/E ratio of 50.19.
The graphic below depicts how EPS has changed over time (unveil the exact values by clicking on the image).
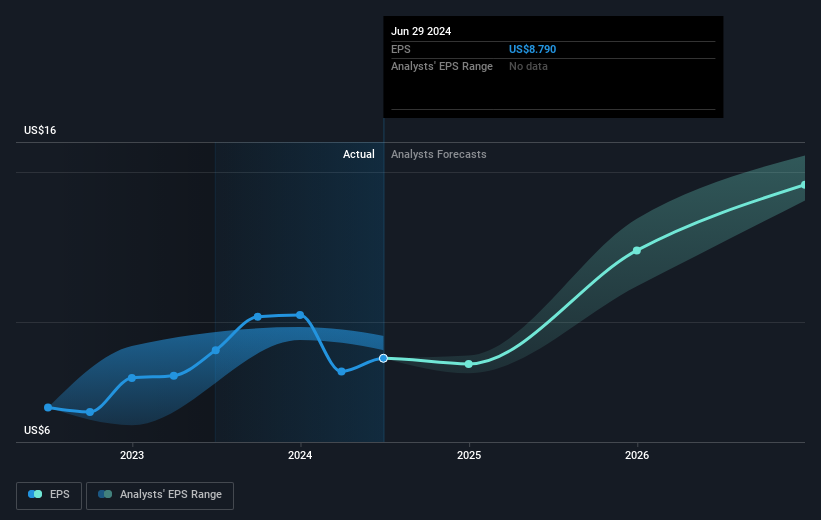
Dive deeper into Motorola Solutions' key metrics by checking this interactive graph of Motorola Solutions's earnings, revenue and cash flow.
What About Dividends?
As well as measuring the share price return, investors should also consider the total shareholder return (TSR). The TSR incorporates the value of any spin-offs or discounted capital raisings, along with any dividends, based on the assumption that the dividends are reinvested. Arguably, the TSR gives a more comprehensive picture of the return generated by a stock. In the case of Motorola Solutions, it has a TSR of 187% for the last 5 years. That exceeds its share price return that we previously mentioned. The dividends paid by the company have thusly boosted the total shareholder return.
A Different Perspective
It's good to see that Motorola Solutions has rewarded shareholders with a total shareholder return of 59% in the last twelve months. That's including the dividend. That gain is better than the annual TSR over five years, which is 23%. Therefore it seems like sentiment around the company has been positive lately. Given the share price momentum remains strong, it might be worth taking a closer look at the stock, lest you miss an opportunity. While it is well worth considering the different impacts that market conditions can have on the share price, there are other factors that are even more important. Consider for instance, the ever-present spectre of investment risk. We've identified 3 warning signs with Motorola Solutions , and understanding them should be part of your investment process.
Of course Motorola Solutions may not be the best stock to buy. So you may wish to see this free collection of growth stocks.
Please note, the market returns quoted in this article reflect the market weighted average returns of stocks that currently trade on American exchanges.
Have feedback on this article? Concerned about the content? Get in touch with us directly. Alternatively, email editorial-team (at) simplywallst.com.
This article by Simply Wall St is general in nature. We provide commentary based on historical data and analyst forecasts only using an unbiased methodology and our articles are not intended to be financial advice. It does not constitute a recommendation to buy or sell any stock, and does not take account of your objectives, or your financial situation. We aim to bring you long-term focused analysis driven by fundamental data. Note that our analysis may not factor in the latest price-sensitive company announcements or qualitative material. Simply Wall St has no position in any stocks mentioned.
