
The most you can lose on any stock (assuming you don't use leverage) is 100% of your money. But on a lighter note, a good company can see its share price rise well over 100%. One great example is Commercial Metals Company (NYSE:CMC) which saw its share price drive 192% higher over five years. The last week saw the share price soften some 5.2%.
Although Commercial Metals has shed US$322m from its market cap this week, let's take a look at its longer term fundamental trends and see if they've driven returns.
While markets are a powerful pricing mechanism, share prices reflect investor sentiment, not just underlying business performance. One imperfect but simple way to consider how the market perception of a company has shifted is to compare the change in the earnings per share (EPS) with the share price movement.
 Over half a decade, Commercial Metals managed to grow its earnings per share at 29% a year. This EPS growth is reasonably close to the 24% average annual increase in the share price. This indicates that investor sentiment towards the company has not changed a great deal. Rather, the share price has approximately tracked EPS growth.
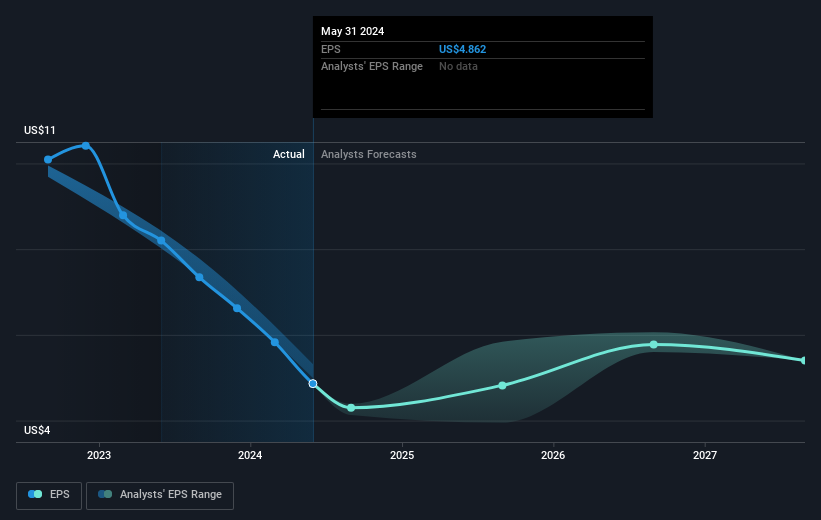
You can see how EPS has changed over time in the image below (click on the chart to see the exact values).
We like that insiders have been buying shares in the last twelve months. Having said that, most people consider earnings and revenue growth trends to be a more meaningful guide to the business. Dive deeper into the earnings by checking this interactive graph of Commercial Metals' earnings, revenue and cash flow.
What About Dividends?
As well as measuring the share price return, investors should also consider the total shareholder return (TSR). The TSR is a return calculation that accounts for the value of cash dividends (assuming that any dividend received was reinvested) and the calculated value of any discounted capital raisings and spin-offs. It's fair to say that the TSR gives a more complete picture for stocks that pay a dividend. We note that for Commercial Metals the TSR over the last 5 years was 219%, which is better than the share price return mentioned above. And there's no prize for guessing that the dividend payments largely explain the divergence!
A Different Perspective
Investors in Commercial Metals had a tough year, with a total loss of 8.3% (including dividends), against a market gain of about 23%. Even the share prices of good stocks drop sometimes, but we want to see improvements in the fundamental metrics of a business, before getting too interested. Longer term investors wouldn't be so upset, since they would have made 26%, each year, over five years. It could be that the recent sell-off is an opportunity, so it may be worth checking the fundamental data for signs of a long term growth trend. I find it very interesting to look at share price over the long term as a proxy for business performance. But to truly gain insight, we need to consider other information, too. Consider risks, for instance. Every company has them, and we've spotted 1 warning sign for Commercial Metals you should know about.
If you like to buy stocks alongside management, then you might just love this free list of companies. (Hint: most of them are flying under the radar).
Please note, the market returns quoted in this article reflect the market weighted average returns of stocks that currently trade on American exchanges.
Have feedback on this article? Concerned about the content? Get in touch with us directly. Alternatively, email editorial-team (at) simplywallst.com.
This article by Simply Wall St is general in nature. We provide commentary based on historical data and analyst forecasts only using an unbiased methodology and our articles are not intended to be financial advice. It does not constitute a recommendation to buy or sell any stock, and does not take account of your objectives, or your financial situation. We aim to bring you long-term focused analysis driven by fundamental data. Note that our analysis may not factor in the latest price-sensitive company announcements or qualitative material. Simply Wall St has no position in any stocks mentioned.
