
Some say volatility, rather than debt, is the best way to think about risk as an investor, but Warren Buffett famously said that 'Volatility is far from synonymous with risk.' When we think about how risky a company is, we always like to look at its use of debt, since debt overload can lead to ruin. As with many other companies Aspen Technology, Inc. (NASDAQ:AZPN) makes use of debt. But should shareholders be worried about its use of debt?
When Is Debt A Problem?
Debt assists a business until the business has trouble paying it off, either with new capital or with free cash flow. If things get really bad, the lenders can take control of the business. However, a more common (but still painful) scenario is that it has to raise new equity capital at a low price, thus permanently diluting shareholders. Of course, the upside of debt is that it often represents cheap capital, especially when it replaces dilution in a company with the ability to reinvest at high rates of return. When we examine debt levels, we first consider both cash and debt levels, together.
What Is Aspen Technology's Net Debt?
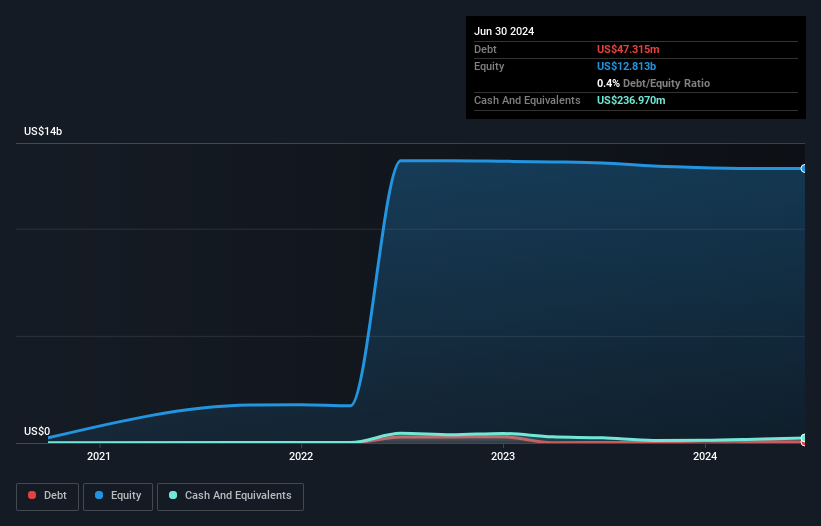
As you can see below, at the end of June 2024, Aspen Technology had US$47.3m of debt, up from US$21.9m a year ago. Click the image for more detail. However, it does have US$237.0m in cash offsetting this, leading to net cash of US$189.7m.
A Look At Aspen Technology's Liabilities
According to the last reported balance sheet, Aspen Technology had liabilities of US$337.4m due within 12 months, and liabilities of US$921.5m due beyond 12 months. Offsetting this, it had US$237.0m in cash and US$603.2m in receivables that were due within 12 months. So its liabilities outweigh the sum of its cash and (near-term) receivables by US$418.7m.
Of course, Aspen Technology has a titanic market capitalization of US$14.8b, so these liabilities are probably manageable. Having said that, it's clear that we should continue to monitor its balance sheet, lest it change for the worse. While it does have liabilities worth noting, Aspen Technology also has more cash than debt, so we're pretty confident it can manage its debt safely. When analysing debt levels, the balance sheet is the obvious place to start. But ultimately the future profitability of the business will decide if Aspen Technology can strengthen its balance sheet over time. So if you're focused on the future you can check out this free report showing analyst profit forecasts.
Over 12 months, Aspen Technology reported revenue of US$1.1b, which is a gain of 8.0%, although it did not report any earnings before interest and tax. That rate of growth is a bit slow for our taste, but it takes all types to make a world.
So How Risky Is Aspen Technology?
Although Aspen Technology had an earnings before interest and tax (EBIT) loss over the last twelve months, it generated positive free cash flow of US$323m. So although it is loss-making, it doesn't seem to have too much near-term balance sheet risk, keeping in mind the net cash. With revenue growth uninspiring, we'd really need to see some positive EBIT before mustering much enthusiasm for this business. When we look at a riskier company, we like to check how their profits (or losses) are trending over time. Today, we're providing readers this interactive graph showing how Aspen Technology's profit, revenue, and operating cashflow have changed over the last few years.
Of course, if you're the type of investor who prefers buying stocks without the burden of debt, then don't hesitate to discover our exclusive list of net cash growth stocks, today.
Have feedback on this article? Concerned about the content? Get in touch with us directly. Alternatively, email editorial-team (at) simplywallst.com.
This article by Simply Wall St is general in nature. We provide commentary based on historical data and analyst forecasts only using an unbiased methodology and our articles are not intended to be financial advice. It does not constitute a recommendation to buy or sell any stock, and does not take account of your objectives, or your financial situation. We aim to bring you long-term focused analysis driven by fundamental data. Note that our analysis may not factor in the latest price-sensitive company announcements or qualitative material. Simply Wall St has no position in any stocks mentioned.