On September 2nd at noon: bitcoin fell to 57,000; the truth of the drop remains to be seen.
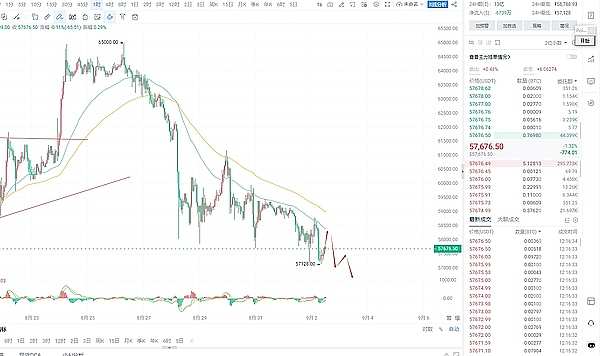
The daily chart of Bitcoin closed with a bearish candlestick, and the future trend will depend on the EMA50 moving average on the daily chart. The MACD moving average indicator on the daily chart is running below the zero axis. In the short term, if we cannot break above the EMA50 moving average, the bearish outlook remains, and we can continue to operate with a bearish strategy. On the four-hour chart, we can see that the candlestick has moved out of the downward trend channel. Since breaking the key level of 57,777, we need to pay attention to whether it is a true or false breakdown. Once it breaks down for real, it will continue to test the level of 54,500. If the price hovers and consolidates at this level, there is a chance for a rebound and breaking the 0.06 million mark. For day trading, we focus on the EMA50 moving average on the hourly chart. The short video updated at noon suggests shorting at 57,800 and adding positions at 58,500. We can still follow this strategy. As for the target, we will see 56,000 and then 54,500 if it breaks above 10,000. For Ethereum, we recommend watching the short video for trading recommendations, and for long-term positions, it is recommended to gradually build a spot position.