
 手游MAU 8.25亿,8月游戏总时长同比增速10.6%
Source: game top
What are the characteristics of the mobile game industry as a whole in 2019? Aurora Mobile Limited released the Mobile Game Industry Research report in 2019, which analyzes the mobile game industry in 2019 from the current situation of the mobile game industry, the types and characteristics of mobile games, the analysis of mobile game users, the payment behavior of mobile game users, and the situation of mobile game users watching live games.
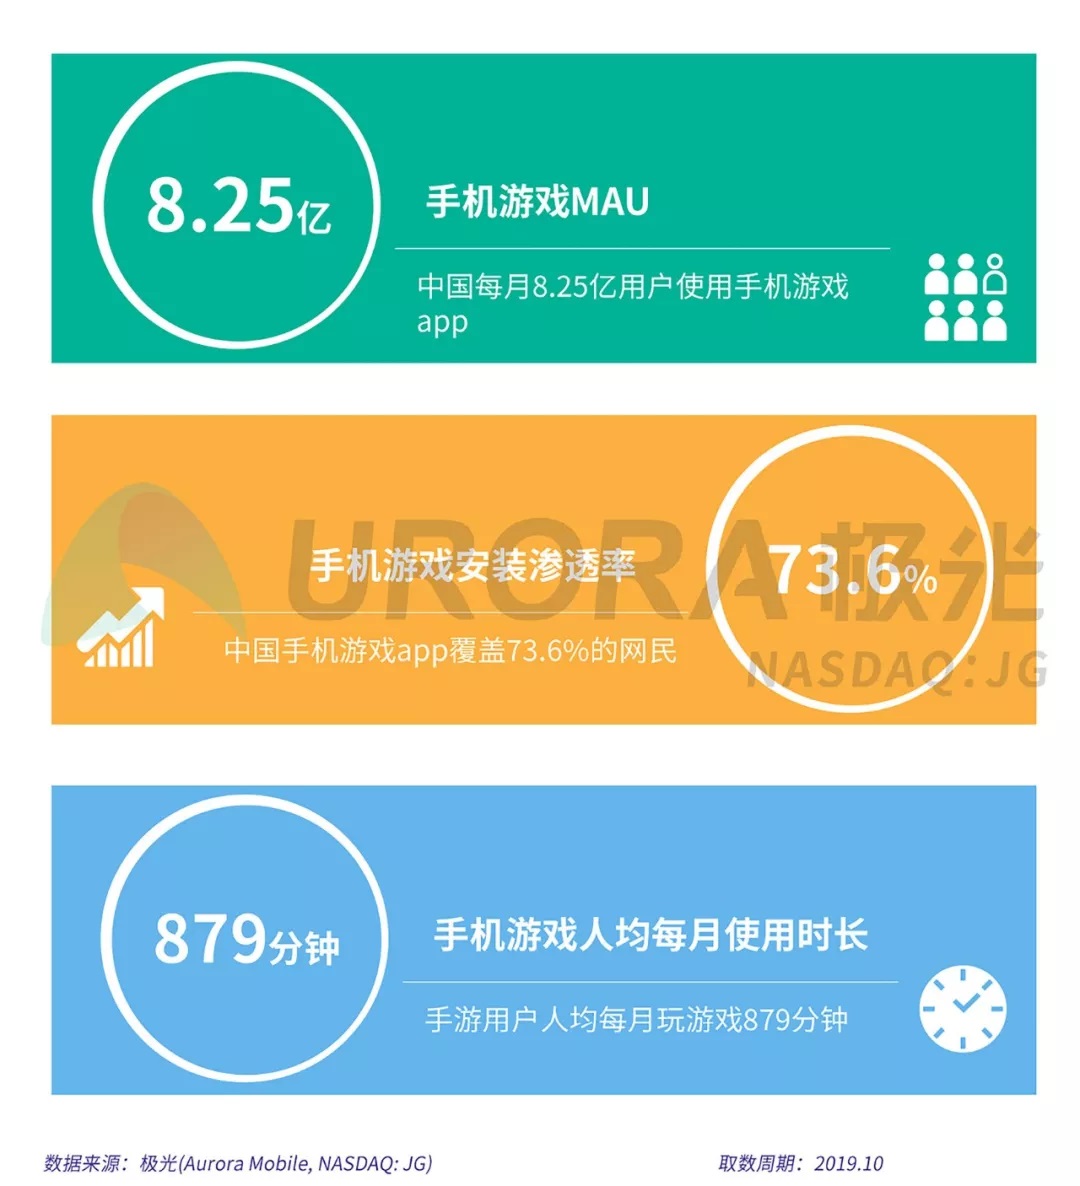
According to the report, the Chinese mobile game App currently covers 73.6% of netizens, with a MAU of 825 million, with an average monthly use time of 879 minutes. Tencent accounts for 58.2% of the game time and NetEase, Inc 4.6%. At present, the payment rate for mobile game users is 63.5%, and there is a lot of room for improvement. Nearly 40% of users who watch live games accept placement ads.
I. the current situation of the mobile game industry
 Mobile games MAU 825 million, the total game time in August increased by 10.6% compared with the same period last year.
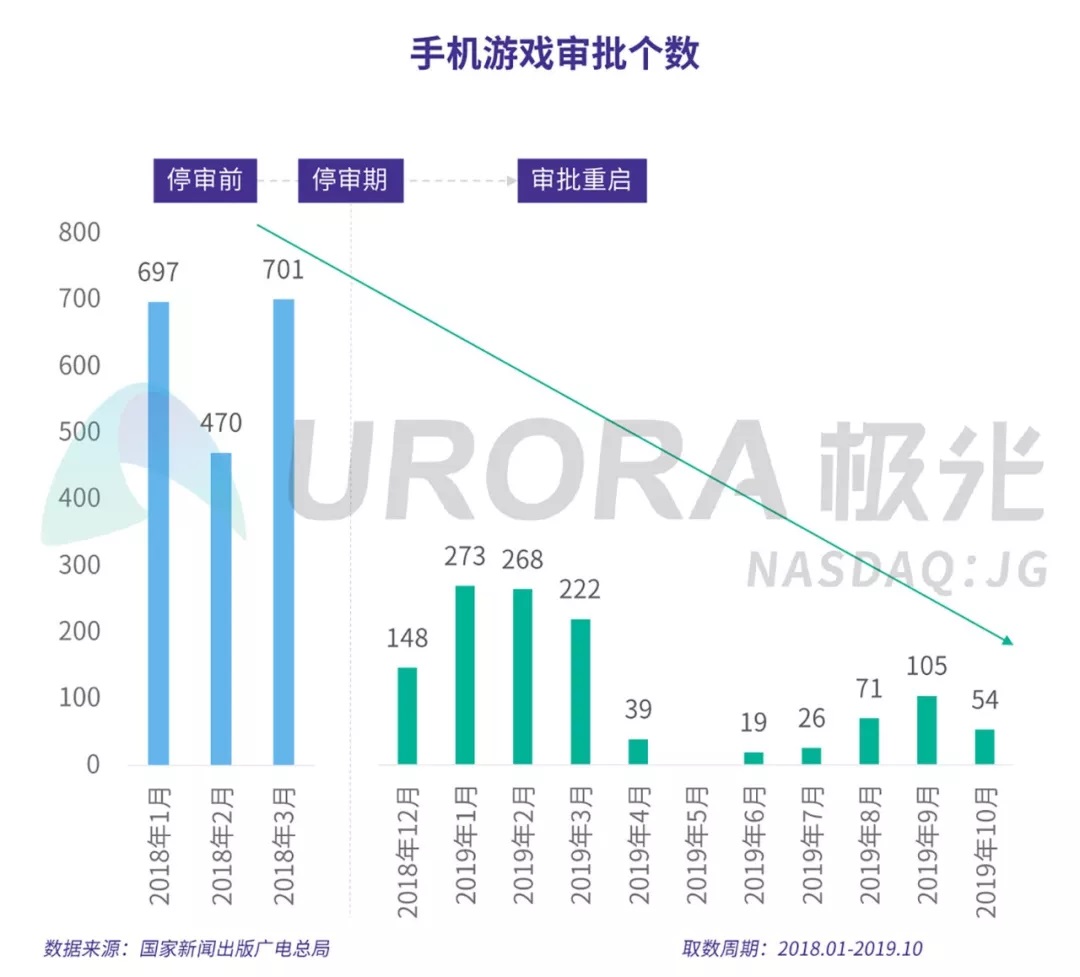
After the version number examination and approval restarted in December 2018, the number of trial version numbers was significantly lower than that before the suspension of trial, and the number decreased further in the second half of 2019, with only 54 in October. The boost to the industry is not obvious.
As a wholeApp, a Chinese mobile game, currently covers 73.6% of netizens, with a MAU of 825 million, with an average monthly use time of 879 minutes.
Due to the low threshold of mobile games, it can fill people's fragmentation time in the past six months.The number of mobile game players among mobile netizens reached 51.8%.It is much larger than PC games (23.1%) and console games (4.9%). At the same time, mobile game players also play the highest frequency of games, reaching 80.8%.

The total duration of mobile games is affected by MAU and per capita duration. According to the report, the overall MAU showed a downward trend in 2019, with the most obvious from January to April and the lowest in February, with MAU falling 20.3% year on year, which also led to a serious decline in the total duration of mobile games, which fell 19.1% in February compared with the same period last year.
Although MAU decreased, the average person spent more time playing games.Since May, driven by the growth of per capita duration, the total duration of mobile games has warmed up compared with the same period last year.It reached its peak in August, with the per capita time growing by 23.9% year-on-year and the total time by 10.6% year-on-year.

The total duration of mobile games is divided by product level, as can be seen in 2019Head TOP5 has the highest proportion of mobile game App users' time, reaching 55.6% (53.0% in 2018).The proportion of TOP10 duration was 62.3% (61.7% in 2018). Compared with 2018, the proportion of head mobile games occupies more time.The concentration of the mobile game industry has increased.

Divided by game manufacturerTencent has obvious advantages in the game industry, accounting for 58.2% of the game time.The penetration rates of its head games "Arena of Valor", "Game for Peace" and "Happy fighting landlords" are 17.0%, 11.2% and 5.7% respectively. The game also contributed a large amount of income to Tencent, with online games accounting for 33.3% of Tencent's income.
NetEase, Inc's game revenue accounts for 59.8 per cent of his total revenue, but the share of game duration is relatively weak, at 4.6 per cent. Its game "my World" has the highest penetration rate of 2.1% and "Onmyoji" has the highest penetration rate of 0.9%.

II. Distribution and characteristics of mobile games
The real-time strategy MAU exceeds 180 million, and the penetration rate of poker and card reaches 20.0%.
From the penetration rate and MAU distribution of all kinds of mobile gamesThe real-time strategy category led by "Arena of Valor" and the flight shooting category led by "Game for Peace" had the highest MAU, with 180 million and 170 million respectively. Poker is dominated by small games, and although the number of MAU ranks third with 150 million, the penetration rate is the highest, reaching 20.0%.

Judging from the duration and MAU distribution of all kinds of mobile gamesReal-time strategy is still the No. 1 category, with a per capita monthly usage time of nearly 1200 minutes.
The average usage time of role-playing and card board games is relatively high, but the MAU is not high, close to or less than 100 million, while the MAU of simulated business and leisure intelligence games is high, but the per capita use time is lower, which is less than 400minutes, which fails to attract users to use for a long time.

III. Analysis of users of mobile games
The student party pays most attention to game design / painting style, and 30.6% of the leisure people get new games on the video / live broadcast platform.
According to the frequency of time users play games, enthusiasm for games and social background characteristics, mobile games are divided into heavy-student party (35.6%), heavy-middle-aged white-collar workers (21.6%), mild-young workers (18.8%) and mild-idle people (23.3%).

It can be found that there are great differences in the types of games preferred by different user groups. Heavy-student party likes heavy games such as real-time strategy and flight shooting, while heavy-middle-aged white-collar workers like games that are less difficult to use, such as card board games, tower defense and so on. Users of light mobile games also prefer light mobile games.

Heavy-the student party loves games most and has the highest initiative. They often mine games in app stores (54.2%) and pay more attention to whether the game design / painting style is satisfactory (63.2%) and whether it is the favorite type of game (62.1%).
And heavy-middle-aged white-collar workers found a new game, in addition to the type of game (52.2%), more affected by the people around Amway (53.9%). Of course, most of their access to new games comes from Wechat / official account / moments (54.8%), and recommendations from relatives and friends (51.3%) also account for a large proportion.

Light users have less initiative to explore new games as a whole. Mild-people who are free to consider a new game, in addition to the type of game (52.4%), will also be affected by the people around them (49.2%). As many as 30.6% of people get new games on video / live streaming platforms.
Mild-young professionals also prefer new games with a desirable design / painting style (47.0%), and most of their access to the game is recommended by friends and relatives (49.0%).

IV. Payment behavior of mobile game users
Mobile game users pay a rate of 63.5%, which is the most attractive to get heroes / characters.
With the development of the legitimate Internet industry, users' awareness of payment has been enhanced, and the willingness of mobile game users to pay has gradually increased. At present,Mobile game users pay a rate of 63.5%.In view of the long time users spend on mobile games, there is plenty of room for fee-based promotion.
Take "Game for Peace" as an example, after the game has the payment function in April, the user payment rate is more than 40%, and the user penetration rate is maintained at around 12%.

From the perspective of different user groupsSevere-the student party has the highest payment rate of 79.5%The amount of payment is also large.Nearly 25% of users pay more than 500 yuan.The payment rate for heavy-middle-aged white-collar workers is not low (72.2%), but only 12.2% for those over 1000 yuan.
The payment rate for light users is relatively low, with only 34.7% for those who are free, and the overall payment amount is not high; the payment rate for young employees is 56.0%, and nearly 50% of users pay less than 500 yuan.

For games that have been played all the time, users are generally more likely to pay than new games.In two contextsPaying for special characters / heroes is the most attractive, with the possibility of paying 23.6% and 19.9%, respectively.Followed by high-level equipment, the possibility of payment is 22.5% and 19.3%.

In the purchase of products around the gamePlayers like mobile phone / computer accessories and clothing accessories most, both of which are purchased at 43.8%.Cosplay props are relatively minority, accounting for only 20.5%.

5. Mobile game users watch live games.
42.8% of the subscribers paid for live streaming, and nearly 40% of the users accepted placement advertisements.
The game live broadcast industry is an extension of the game industry. 65.3% of mobile game users watch the game live. Among them, 29.9% watch the game live broadcast every day, and nearly 70% watch it at least once a week.

Among the mobile game users who watch the game live.More male users (TGI is 115.7), and mainly post-80s, post-90s and post-00s (TGI are all more than 100). Most of them are game masters (TGI is 130.6), have many friends (TGI is 124.5), like binary (TGI is 120.0), like Cosplay (TGI is 137.8).

Among all the live streaming platforms, the game live broadcast platform, the live broadcast channel of the short video platform and the live broadcast channel within the game App are the three major channels for users to watch the game live broadcast.
In the game live broadcast platformBoth DouYu International Holdings Limited and HUYA Inc. account for more than 30 per cent of users.Forty-eight percent of users watch the game live on "E-Meow Live" launched by Kuaishou Technology, a short video platform. 35.6% of people watch live streaming in the game.

In all the live games"Arena of Valor" is the most popular, accounting for more than 50% of users.This was followed by "PUBG" and "League of Legends", both of which accounted for about 40 per cent of viewing users.

In the game live broadcastLess than half of the paying users, only 42.8%And more than 40% of paying users paid less than 100 yuan in the past year, while 12.8% paid 1000 yuan or more.
57.2% of the users do not pay, and most of them do not pay because the reward / recharge members are too expensive (30.7%), and the lack of much improvement in the post-reward experience (28.6%) and no favorite content (26.6%) are also the reasons why they do not pay.

Implant ads for live gamesNearly 40% of the users accepted it.27% of users think it doesn't matter, and only 11.3% are very disgusted, indicating that users have a high degree of acceptance of advertising.

Edit / Jeffy
