
The external fund manager backed by Berkshire Hathaway's Charlie Munger, Li Lu, makes no bones about it when he says 'The biggest investment risk is not the volatility of prices, but whether you will suffer a permanent loss of capital.' When we think about how risky a company is, we always like to look at its use of debt, since debt overload can lead to ruin. We can see that John Bean Technologies Corporation (NYSE:JBT) does use debt in its business. But is this debt a concern to shareholders?
What Risk Does Debt Bring?
Debt assists a business until the business has trouble paying it off, either with new capital or with free cash flow. If things get really bad, the lenders can take control of the business. While that is not too common, we often do see indebted companies permanently diluting shareholders because lenders force them to raise capital at a distressed price. Of course, plenty of companies use debt to fund growth, without any negative consequences. The first step when considering a company's debt levels is to consider its cash and debt together.
What Is John Bean Technologies's Net Debt?
As you can see below, John Bean Technologies had US$647.6m of debt at June 2024, down from US$950.5m a year prior. On the flip side, it has US$475.3m in cash leading to net debt of about US$172.3m.
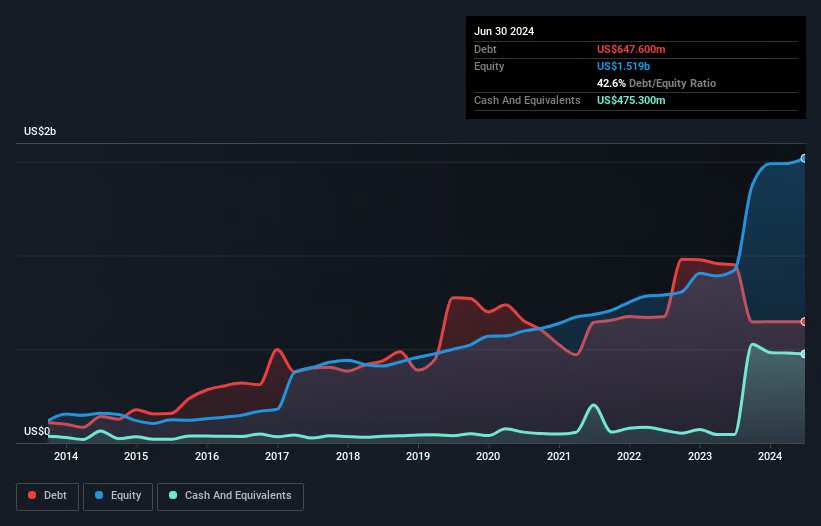
A Look At John Bean Technologies' Liabilities
The latest balance sheet data shows that John Bean Technologies had liabilities of US$442.9m due within a year, and liabilities of US$728.4m falling due after that. Offsetting this, it had US$475.3m in cash and US$311.5m in receivables that were due within 12 months. So its liabilities outweigh the sum of its cash and (near-term) receivables by US$384.5m.
Since publicly traded John Bean Technologies shares are worth a total of US$2.82b, it seems unlikely that this level of liabilities would be a major threat. But there are sufficient liabilities that we would certainly recommend shareholders continue to monitor the balance sheet, going forward.
We use two main ratios to inform us about debt levels relative to earnings. The first is net debt divided by earnings before interest, tax, depreciation, and amortization (EBITDA), while the second is how many times its earnings before interest and tax (EBIT) covers its interest expense (or its interest cover, for short). Thus we consider debt relative to earnings both with and without depreciation and amortization expenses.
John Bean Technologies has net debt of just 0.68 times EBITDA, suggesting it could ramp leverage without breaking a sweat. And remarkably, despite having net debt, it actually received more in interest over the last twelve months than it had to pay. So it's fair to say it can handle debt like a hotshot teppanyaki chef handles cooking. While John Bean Technologies doesn't seem to have gained much on the EBIT line, at least earnings remain stable for now. When analysing debt levels, the balance sheet is the obvious place to start. But ultimately the future profitability of the business will decide if John Bean Technologies can strengthen its balance sheet over time. So if you want to see what the professionals think, you might find this free report on analyst profit forecasts to be interesting.
Finally, while the tax-man may adore accounting profits, lenders only accept cold hard cash. So the logical step is to look at the proportion of that EBIT that is matched by actual free cash flow. Looking at the most recent three years, John Bean Technologies recorded free cash flow of 22% of its EBIT, which is weaker than we'd expect. That weak cash conversion makes it more difficult to handle indebtedness.
Our View
On our analysis John Bean Technologies's interest cover should signal that it won't have too much trouble with its debt. However, our other observations weren't so heartening. For instance it seems like it has to struggle a bit to convert EBIT to free cash flow. Considering this range of data points, we think John Bean Technologies is in a good position to manage its debt levels. But a word of caution: we think debt levels are high enough to justify ongoing monitoring. Over time, share prices tend to follow earnings per share, so if you're interested in John Bean Technologies, you may well want to click here to check an interactive graph of its earnings per share history.
When all is said and done, sometimes its easier to focus on companies that don't even need debt. Readers can access a list of growth stocks with zero net debt 100% free, right now.
Have feedback on this article? Concerned about the content? Get in touch with us directly. Alternatively, email editorial-team (at) simplywallst.com.
This article by Simply Wall St is general in nature. We provide commentary based on historical data and analyst forecasts only using an unbiased methodology and our articles are not intended to be financial advice. It does not constitute a recommendation to buy or sell any stock, and does not take account of your objectives, or your financial situation. We aim to bring you long-term focused analysis driven by fundamental data. Note that our analysis may not factor in the latest price-sensitive company announcements or qualitative material. Simply Wall St has no position in any stocks mentioned.