
Just because a business does not make any money, does not mean that the stock will go down. For example, although Amazon.com made losses for many years after listing, if you had bought and held the shares since 1999, you would have made a fortune. But while the successes are well known, investors should not ignore the very many unprofitable companies that simply burn through all their cash and collapse.
Given this risk, we thought we'd take a look at whether CG Oncology (NASDAQ:CGON) shareholders should be worried about its cash burn. In this report, we will consider the company's annual negative free cash flow, henceforth referring to it as the 'cash burn'. We'll start by comparing its cash burn with its cash reserves in order to calculate its cash runway.
How Long Is CG Oncology's Cash Runway?
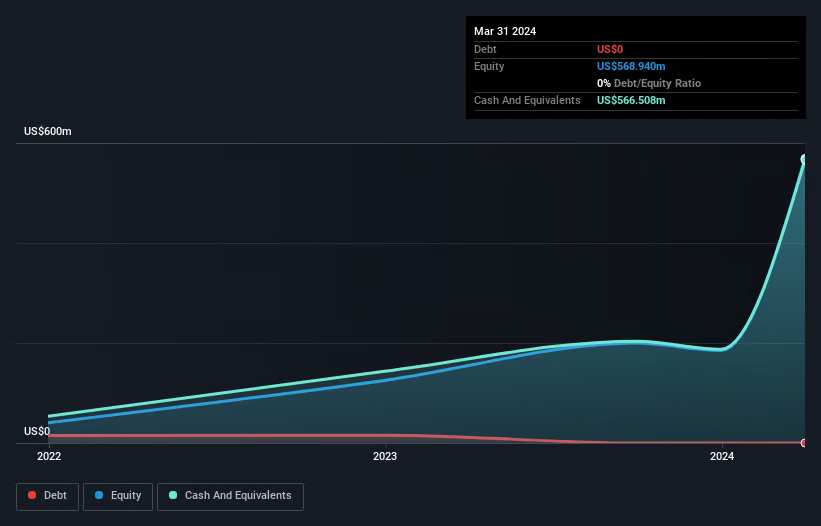
A company's cash runway is calculated by dividing its cash hoard by its cash burn. When CG Oncology last reported its March 2024 balance sheet in May 2024, it had zero debt and cash worth US$567m. Importantly, its cash burn was US$64m over the trailing twelve months. Therefore, from March 2024 it had 8.9 years of cash runway. Importantly, though, analysts think that CG Oncology will reach cashflow breakeven before then. If that happens, then the length of its cash runway, today, would become a moot point. The image below shows how its cash balance has been changing over the last few years.
How Is CG Oncology's Cash Burn Changing Over Time?
In our view, CG Oncology doesn't yet produce significant amounts of operating revenue, since it reported just US$539k in the last twelve months. As a result, we think it's a bit early to focus on the revenue growth, so we'll limit ourselves to looking at how the cash burn is changing over time. During the last twelve months, its cash burn actually ramped up 99%. Oftentimes, increased cash burn simply means a company is accelerating its business development, but one should always be mindful that this causes the cash runway to shrink. Clearly, however, the crucial factor is whether the company will grow its business going forward. For that reason, it makes a lot of sense to take a look at our analyst forecasts for the company.
How Easily Can CG Oncology Raise Cash?
While CG Oncology does have a solid cash runway, its cash burn trajectory may have some shareholders thinking ahead to when the company may need to raise more cash. Companies can raise capital through either debt or equity. Many companies end up issuing new shares to fund future growth. We can compare a company's cash burn to its market capitalisation to get a sense for how many new shares a company would have to issue to fund one year's operations.
CG Oncology has a market capitalisation of US$2.4b and burnt through US$64m last year, which is 2.6% of the company's market value. So it could almost certainly just borrow a little to fund another year's growth, or else easily raise the cash by issuing a few shares.
Is CG Oncology's Cash Burn A Worry?
As you can probably tell by now, we're not too worried about CG Oncology's cash burn. In particular, we think its cash runway stands out as evidence that the company is well on top of its spending. Although we do find its increasing cash burn to be a bit of a negative, once we consider the other metrics mentioned in this article together, the overall picture is one we are comfortable with. Shareholders can take heart from the fact that analysts are forecasting it will reach breakeven. Looking at all the measures in this article, together, we're not worried about its rate of cash burn; the company seems well on top of its medium-term spending needs. Taking a deeper dive, we've spotted 2 warning signs for CG Oncology you should be aware of, and 1 of them makes us a bit uncomfortable.
Of course, you might find a fantastic investment by looking elsewhere. So take a peek at this free list of interesting companies, and this list of stocks growth stocks (according to analyst forecasts)
Have feedback on this article? Concerned about the content? Get in touch with us directly. Alternatively, email editorial-team (at) simplywallst.com.
This article by Simply Wall St is general in nature. We provide commentary based on historical data and analyst forecasts only using an unbiased methodology and our articles are not intended to be financial advice. It does not constitute a recommendation to buy or sell any stock, and does not take account of your objectives, or your financial situation. We aim to bring you long-term focused analysis driven by fundamental data. Note that our analysis may not factor in the latest price-sensitive company announcements or qualitative material. Simply Wall St has no position in any stocks mentioned.