
The downward trend of second-hand housing prices in the top ten cities remains unchanged.
According to the data from the China Index Research Institute, as of July 2024, the average price of second-hand homes in the top 100 cities was 14,653 yuan/square meter, a month-on-month decrease of 0.74%, an increase of 0.01 percentage points compared to June, and a continuous decrease for 27 consecutive months. The year-on-year decline was 6.58%, with a increase of 0.33 percentage points compared to June. In July, the average price of second-hand homes in the top ten cities decreased by 0.84% month-on-month, with an increase of 0.13 percentage points compared to June; the year-on-year decrease was 6.64%, with an increase of 0.46 percentage points compared to June. The trend of owners trading price for quantity continues, and second-hand housing transactions in key cities continue to increase.
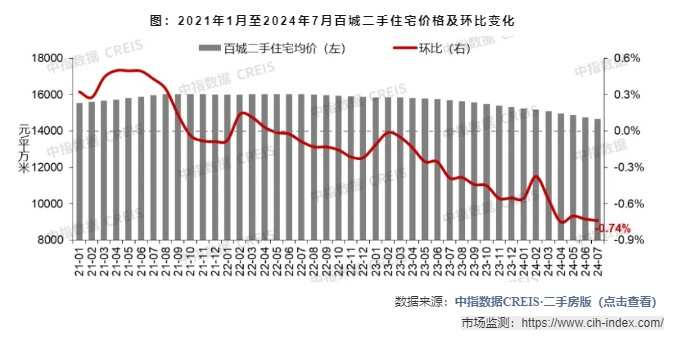
In July, the prices of second-hand homes in 100 cities continued to decline.
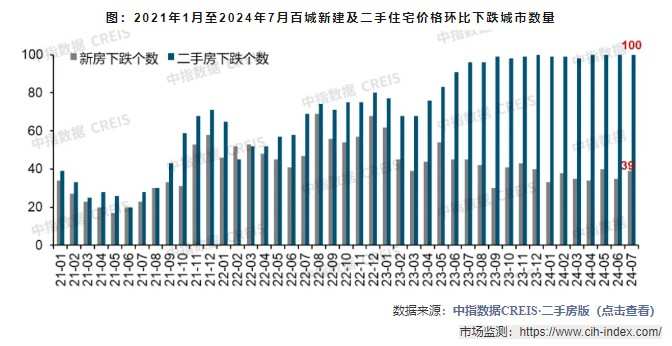
From the perspective of the number of cities with rising and falling housing prices, according to the China Index Research Institute's Hundred Cities Price Index, in July, the number of cities with a month-on-month decline in second-hand housing prices was 100, which has been declining in the hundred cities for four consecutive months. The number of cities with a month-on-month decline in new housing prices in the hundred cities was 39, an increase of 4 from June.

The downward trend in second-hand housing prices in the top ten cities remains unchanged. In terms of month-on-month changes, Wuhan and Chongqing (main urban area) had larger declines, at 1.26% and 1.25% respectively; Hangzhou, Nanjing, Shanghai, and Beijing had declines ranging from 0.8% to 1.0%; Tianjin, Guangzhou, Shenzhen, and Chengdu had declines ranging from 0.6% to 0.8%. In terms of year-on-year changes, Wuhan had the largest decline, at 10.63%; Nanjing, Chongqing (main urban area), and Hangzhou followed closely, with year-on-year declines of 9.59%, 8.79%, and 7.24% respectively; Beijing, Shanghai, Chengdu, Tianjin, and Guangzhou had declines ranging from 5% to 7%; Shenzhen had the smallest decline, at 4.27%.
