
 美国就业增长可能远不如之前报告的那么强劲,这给美联储带来下个月降息的压力。
Source: Zhitong Finance
"Since 1950, the S&P 500 index has risen more than 10% 21 times as of the end of May. In about 90% of these cases, the S&P 500 index rose for the rest of the year. There were only two instances of declines for the rest of the year, in 1987 (-13%) and 1986 (-0.1%)."
With the rebound of the stock market, the old adage "Sell in May and Go Away" seems to have been a bad advice once again. Last month, the S&P 500 index rose 4.8%, the best May performance since 2009. The NASDAQ 100 index rose nearly 6.2%, and the NASDAQ Composite Index rose 6.9%. Goldman Sachs FICC & Equities Trading Division said: "History doesn't really support this saying. Don't sell, leave the market (go on vacation), and enjoy the good times."
The rising trend is still to be continued?
If history is any guide, it may indicate that the rise of the stock market is not over yet.
Looking ahead to the rest of 2024, Scott Rubner, Managing Director of the Goldman Sachs Global Markets Division and tactical expert, pointed out the following historical background for investors.
Rubner stated that the S&P 500 index has risen 10.7% year-to-date, and since 1950, the S&P 500 index has risen more than 10% 21 times as of the end of May. In about 90% of these cases, the S&P 500 index rose for the rest of the year. There were only two instances of declines for the rest of the year, in 1987 (-13%) and 1986 (-0.1%).
"Since 1950, the median return of the last 7 months of each year (June 1 to December 31) is 5.4%. In the aforementioned 21 cases, the average performance of the last 7 months increased to 8.1%." Rubner added.
Rubner also pointed out that the NASDAQ index has risen for 16 consecutive Julys, with an average return of about 4.64%.
By Yu Jing
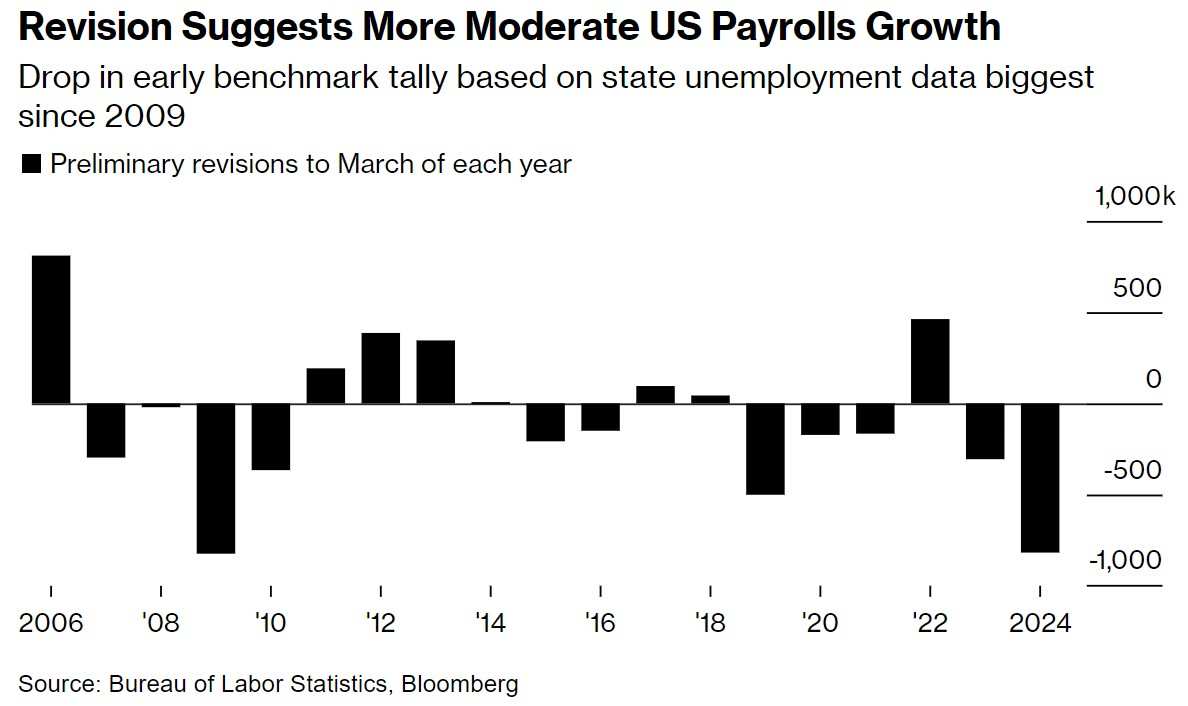
The growth in US employment may not be as strong as previously reported, putting pressure on the Fed to cut interest rates next month.
The U.S. Bureau of Labor Statistics announced on Wednesday that in the 12 months ending March 2024,non-farm payroll dataA preliminary downward revision of 0.818 million people. This number is roughly within the range analyzed by economists beforehand.
The growth in US employment may not be as strong as previously reported, putting pressure on the Fed to cut interest rates next month.
 Previously released nonfarm data showed a total addition of 2.9 million jobs in the adjusted reporting period, averaging 0.242 million people per month. After deducting 0.818 million people, the monthly average growth rate will decrease to 0.174 million people. Although the rebound in the labor market after the epidemic has slowed down, it is still considered a relatively healthy economic state. Traditionally, the final adjusted data will be released early next year.
Revised data indicates that the labor market began to slow down much earlier than originally expected. It wasn't until earlier this month that both the market and economists became concerned about the release of the July employment report. The weak employment report, with the unemployment rate rising for the fourth consecutive month, sounded alarm bells, but other indicators such as unemployment claims and job vacancies suggest a more moderate economic slowdown.
Robert Frick, the corporate economist at the Navy Federal Credit Union, said in a report: "Given the estimated reduction of 1 million jobs, these revisions are not surprising. This does not challenge our view that we are still in an expansion phase, but it does suggest that we should expect more modest monthly job growth, putting additional pressure on the Fed to cut interest rates."
The data reinforced expectations for the Fed to start cutting interest rates next month, and U.S. Treasury prices rose slightly. Traders expect the Fed to cut rates by a quarter percentage point next month, with a 20% chance of a half percentage point cut.
Wednesday's data will help Fed Chair Powell make the latest assessment of the labor market before his speech at the central bank's annual symposium in Jackson Hole on Friday. With inflation easing from its pandemic peak, policymakers have recently shifted their focus to the labor aspect of their dual mandate.
Benchmark revisions are done annually, but this year market observers and Fed watchers are particularly focused on benchmark revisions, looking for any signs indicating that the labor market may be cooling down faster than initially reported.
Several economists have noted that initial employment data may be influenced by several factors, including adjustments for business births and deaths, as well as adjustments in how unauthorized immigrant workers are counted.
Professional services and business services accounted for nearly half of the downward revision. Other industries also saw declines, including leisure and hospitality, manufacturing, and retail trade.
Economist Anna Wong stated, "We believe these revisions indicate that the labor market has been much weaker than most people thought for much of last year. It is worth noting that the main reason for the downward revision is in the white-collar industries, such as professional and business services, which generally do not attract a large number of undocumented workers. This should help alleviate concerns about the benchmark series underestimating undocumented workers."
The U.S. Bureau of Labor Statistics compiles monthly employment reports based on two surveys. Wednesday's revision involves payroll (collected through business surveys), without affecting the unemployment rate (obtained through household surveys).
The U.S. Bureau of Labor Statistics annually compares March employment figures with a more accurate but less timely data source, the Quarterly Census of Employment and Wages (QCEW), based on state unemployment insurance tax records covering almost all U.S. employment positions.
QCEW data was also released on Wednesday, showing a 1.3% increase in employment rate for the year ending in March 2024. In contrast, the annual growth rate based on the initial monthly payroll data is 1.9%.
Both presidential candidates use this data to illustrate the economic situation. Former President Trump and Republicans state that these data confirm a much weaker labor market than initially reported. White House senior economic adviser Jared Bernstein stated in a declaration that the preliminary estimates do not change the fact that the job recovery has been "historically strong".
Wednesday's revisions apply to overall employment figures for March 2024 compared to the previous year. The final data will be released alongside the January 2025 employment report, and revisions will be itemized monthly.
In recent years, initial employment data each month has been stronger than QCEW data. Some economists attribute this in part to a method called the birth-death model—a BLS adjustment to reflect the net quantity of opening and closing businesses, but in the post-pandemic era, this adjustment may not be accurate.
Others believe that behind this difference lies another reason: immigration. Since QCEW reports are based on unemployment insurance records (inaccessible to undocumented immigrants), the data may exclude thousands of unauthorized workers not captured in initial payroll estimates.
Editor/rice
