
In today's rapidly changing and fiercely competitive business landscape, it is vital for investors and industry enthusiasts to carefully evaluate companies. In this article, we will perform a comprehensive industry comparison, evaluating Palantir Technologies (NYSE:PLTR) against its key competitors in the Software industry. By analyzing important financial metrics, market position, and growth prospects, we aim to provide valuable insights for investors and shed light on company's performance within the industry.
Palantir Technologies Background
Palantir is an analytical software company that focuses on leveraging data to create efficiencies in its clients' organizations. The firm serves commercial and government clients via its Foundry and Gotham platforms, respectively. The Denver-based company was founded in 2003 and went public in 2020.
| Company | P/E | P/B | P/S | ROE | EBITDA (in billions) | Gross Profit (in billions) | Revenue Growth |
|---|---|---|---|---|---|---|---|
| Palantir Technologies Inc | 191.18 | 17.97 | 31.14 | 3.43% | $0.11 | $0.55 | 27.15% |
| Salesforce Inc | 47.73 | 4.31 | 7.30 | 2.57% | $2.6 | $6.97 | 10.74% |
| SAP SE | 91.94 | 5.56 | 7.17 | 2.1% | $1.94 | $6.02 | 9.72% |
| Adobe Inc | 50.69 | 16.82 | 12.58 | 10.38% | $2.19 | $4.71 | 10.24% |
| Intuit Inc | 61.30 | 9.89 | 11.90 | 13.4% | $3.34 | $5.67 | 11.95% |
| Synopsys Inc | 60.87 | 11.96 | 13.75 | 4.23% | $0.41 | $1.15 | 15.2% |
| Cadence Design Systems Inc | 73.05 | 18.12 | 18.50 | 5.86% | $0.38 | $0.92 | 8.61% |
| Workday Inc | 41.47 | 7.56 | 8.23 | 1.32% | $0.23 | $1.5 | 18.17% |
| Roper Technologies Inc | 41.10 | 3.25 | 9.01 | 1.88% | $0.69 | $1.19 | 12.12% |
| Autodesk Inc | 54.59 | 25.04 | 9.62 | 12.55% | $0.34 | $1.28 | 11.66% |
| Datadog Inc | 249.38 | 16.42 | 18.03 | 1.9% | $0.06 | $0.52 | 26.66% |
| AppLovin Corp | 36.67 | 35.20 | 7.60 | 39.35% | $0.51 | $0.8 | 43.98% |
| Ansys Inc | 57.76 | 5.11 | 12.32 | 2.37% | $0.2 | $0.52 | 19.64% |
| Tyler Technologies Inc | 120 | 7.90 | 12.30 | 2.2% | $0.12 | $0.24 | 7.28% |
| PTC Inc | 71.98 | 7.03 | 9.58 | 2.32% | $0.13 | $0.41 | -4.37% |
| Zoom Video Communications Inc | 22.07 | 2.23 | 4.08 | 2.65% | $0.23 | $0.87 | 3.25% |
| Manhattan Associates Inc | 79.19 | 66.11 | 16.28 | 21.98% | $0.07 | $0.15 | 14.85% |
| Bentley Systems Inc | 43.72 | 15.44 | 13.04 | 7.52% | $0.1 | $0.27 | 11.32% |
| Dynatrace Inc | 96.02 | 7.19 | 10.02 | 1.89% | $0.06 | $0.32 | 19.93% |
| Average | 72.2 | 14.73 | 11.18 | 7.58% | $0.76 | $1.86 | 13.94% |
After a detailed analysis of Palantir Technologies, the following trends become apparent:
Notably, the current Price to Earnings ratio for this stock, 191.18, is 2.65x above the industry norm, reflecting a higher valuation relative to the industry.
The elevated Price to Book ratio of 17.97 relative to the industry average by 1.22x suggests company might be overvalued based on its book value.
The stock's relatively high Price to Sales ratio of 31.14, surpassing the industry average by 2.79x, may indicate an aspect of overvaluation in terms of sales performance.
The Return on Equity (ROE) of 3.43% is 4.15% below the industry average, suggesting potential inefficiency in utilizing equity to generate profits.
Compared to its industry, the company has lower Earnings Before Interest, Taxes, Depreciation, and Amortization (EBITDA) of $110 Million, which is 0.14x below the industry average, potentially indicating lower profitability or financial challenges.
The gross profit of $550 Million is 0.3x below that of its industry, suggesting potential lower revenue after accounting for production costs.
The company is experiencing remarkable revenue growth, with a rate of 27.15%, outperforming the industry average of 13.94%.
Debt To Equity Ratio
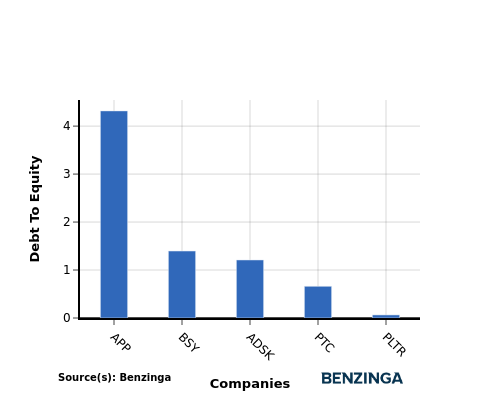
The debt-to-equity (D/E) ratio helps evaluate the capital structure and financial leverage of a company.
Considering the debt-to-equity ratio in industry comparisons allows for a concise evaluation of a company's financial health and risk profile, aiding in informed decision-making.
When examining Palantir Technologies in comparison to its top 4 peers with respect to the Debt-to-Equity ratio, the following information becomes apparent:
Compared to its top 4 peers, Palantir Technologies has a stronger financial position indicated by its lower debt-to-equity ratio of 0.06.
This suggests that the company relies less on debt financing and has a more favorable balance between debt and equity, which can be seen as a positive attribute by investors.
Key Takeaways
For Palantir Technologies, the PE, PB, and PS ratios are all high compared to its peers in the Software industry, indicating potentially overvalued stock. On the other hand, the low ROE, EBITDA, and gross profit suggest lower profitability levels compared to industry peers. However, the high revenue growth rate may indicate potential for future growth and market expansion.
This article was generated by Benzinga's automated content engine and reviewed by an editor.