
Howard Marks put it nicely when he said that, rather than worrying about share price volatility, 'The possibility of permanent loss is the risk I worry about... and every practical investor I know worries about.' When we think about how risky a company is, we always like to look at its use of debt, since debt overload can lead to ruin. We can see that Amdocs Limited (NASDAQ:DOX) does use debt in its business. But the more important question is: how much risk is that debt creating?
When Is Debt A Problem?
Generally speaking, debt only becomes a real problem when a company can't easily pay it off, either by raising capital or with its own cash flow. Ultimately, if the company can't fulfill its legal obligations to repay debt, shareholders could walk away with nothing. While that is not too common, we often do see indebted companies permanently diluting shareholders because lenders force them to raise capital at a distressed price. Of course, plenty of companies use debt to fund growth, without any negative consequences. When we think about a company's use of debt, we first look at cash and debt together.
How Much Debt Does Amdocs Carry?
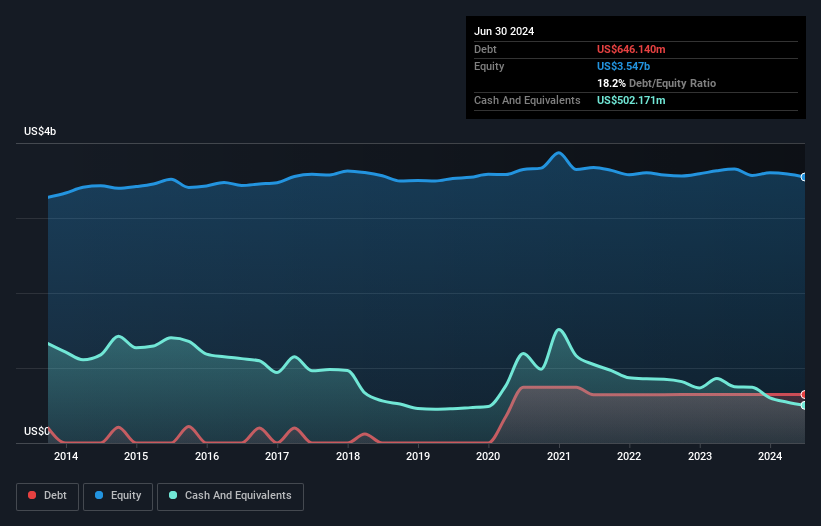
As you can see below, Amdocs had US$646.1m of debt, at June 2024, which is about the same as the year before. You can click the chart for greater detail. On the flip side, it has US$502.2m in cash leading to net debt of about US$144.0m.
How Strong Is Amdocs' Balance Sheet?
 We can see from the most recent balance sheet that Amdocs had liabilities of US$1.42b falling due within a year, and liabilities of US$1.43b due beyond that. On the other hand, it had cash of US$502.2m and US$1.02b worth of receivables due within a year. So its liabilities outweigh the sum of its cash and (near-term) receivables by US$1.33b.
Given Amdocs has a market capitalization of US$9.72b, it's hard to believe these liabilities pose much threat. But there are sufficient liabilities that we would certainly recommend shareholders continue to monitor the balance sheet, going forward. Carrying virtually no net debt, Amdocs has a very light debt load indeed.
We use two main ratios to inform us about debt levels relative to earnings. The first is net debt divided by earnings before interest, tax, depreciation, and amortization (EBITDA), while the second is how many times its earnings before interest and tax (EBIT) covers its interest expense (or its interest cover, for short). Thus we consider debt relative to earnings both with and without depreciation and amortization expenses.
Amdocs has a low net debt to EBITDA ratio of only 0.15. And its EBIT easily covers its interest expense, being 58.2 times the size. So we're pretty relaxed about its super-conservative use of debt. The good news is that Amdocs has increased its EBIT by 4.7% over twelve months, which should ease any concerns about debt repayment. The balance sheet is clearly the area to focus on when you are analysing debt. But ultimately the future profitability of the business will decide if Amdocs can strengthen its balance sheet over time. So if you want to see what the professionals think, you might find this free report on analyst profit forecasts to be interesting.
Finally, a company can only pay off debt with cold hard cash, not accounting profits. So it's worth checking how much of that EBIT is backed by free cash flow. Over the last three years, Amdocs recorded free cash flow worth a fulsome 85% of its EBIT, which is stronger than we'd usually expect. That positions it well to pay down debt if desirable to do so.
Our View
Happily, Amdocs's impressive interest cover implies it has the upper hand on its debt. And that's just the beginning of the good news since its conversion of EBIT to free cash flow is also very heartening. Zooming out, Amdocs seems to use debt quite reasonably; and that gets the nod from us. After all, sensible leverage can boost returns on equity. Above most other metrics, we think its important to track how fast earnings per share is growing, if at all. If you've also come to that realization, you're in luck, because today you can view this interactive graph of Amdocs's earnings per share history for free.
Of course, if you're the type of investor who prefers buying stocks without the burden of debt, then don't hesitate to discover our exclusive list of net cash growth stocks, today.
Have feedback on this article? Concerned about the content? Get in touch with us directly. Alternatively, email editorial-team (at) simplywallst.com.
This article by Simply Wall St is general in nature. We provide commentary based on historical data and analyst forecasts only using an unbiased methodology and our articles are not intended to be financial advice. It does not constitute a recommendation to buy or sell any stock, and does not take account of your objectives, or your financial situation. We aim to bring you long-term focused analysis driven by fundamental data. Note that our analysis may not factor in the latest price-sensitive company announcements or qualitative material. Simply Wall St has no position in any stocks mentioned.
