
The Federal Reserve has cut interest rates 4 times as a bailout and 5 times as a precautionary interest rate since 1982. According to the purpose of interest rate cuts, the Fed's interest rate cuts can be divided into two categories: relief interest rate cuts and preventive interest rate cuts
Core conclusion: ① The Federal Reserve's interest rate cuts include two types. Relief interest rate cuts are common after a crisis occurs. Preventive interest rate cuts are mostly larger and last longer when the economy shows signs of slowing down. ② Equity assets have a high win rate during the preventative interest rate cut period. After interest rate cuts, interest rates on US bonds declined, and Chinese debt also declined in the short term. The US dollar is likely to weaken, and gold is more flexible to rise during bailout interest rate cuts. ③ Looking ahead, the Federal Reserve is likely to enter a cycle of interest rate cuts. Combined with improvements in domestic fundamentals, the market center is expected to rise, and the industry will focus on manufacturing advantages in the medium term.
The impact of successive Fed interest rate cuts on asset prices
Recently, US inflation data has continued to decline and high-frequency economic data has weakened marginally. The market generally expects the Federal Reserve to start cutting interest rates in September. Looking ahead to the second half of the year, the Fed's interest rate cut will be a key factor affecting global asset price trends. Taking history as a guide, what is the pattern and pace of the Fed cutting interest rates in history? How did global asset prices perform during the interest rate cut cycle? This article explores this.
1. Relief Interest Rate Cuts: Policy Measures Adopted in Response to Sudden Shocks
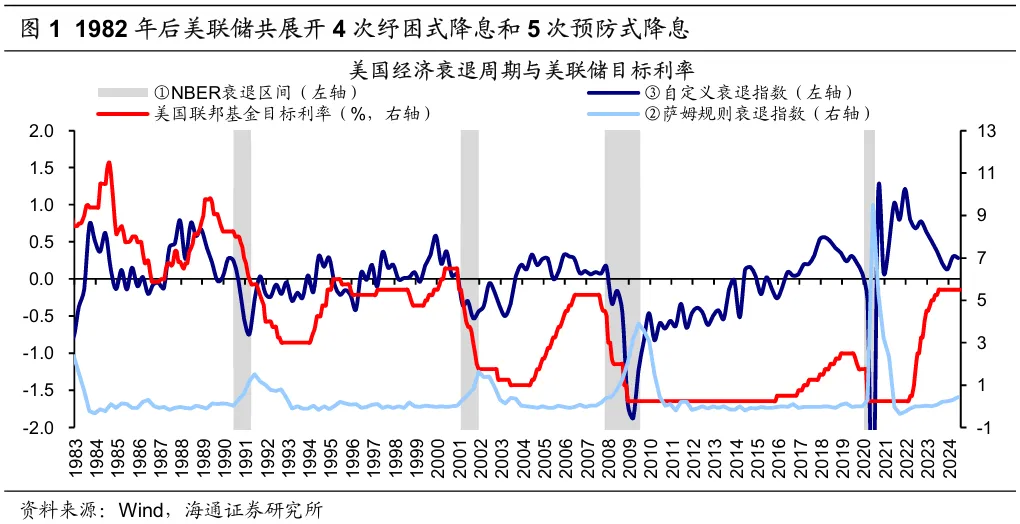
The Federal Reserve has cut interest rates 4 times as a bailout and 5 times as a precautionary interest rate since 1982. According to the purpose of interest rate cuts, the Federal Reserve's interest rate cuts can be divided into two categories: bailout interest rate cuts and preventive interest rate cuts. The main difference between the two is whether the US economy has already entered recession when interest rates are cut. The former often occurs after a clear recession and is used to stimulate the economy, while the latter is common when the recession has not yet occurred and is aimed at preventing the risk of recession.
So how can we quantitatively determine whether the US economy is in recession? There are three commonly used methods: ① NBER recession range: The US National Bureau of Economic Research NBER is the authority that defines the US economic cycle. It determines the recession range by considering six major indicators, including actual personal income and non-farm payrolls after deducting transfer payments. ② Sam's Rule Recession Index: Economist Claudia Sahm proposed the Sam Rule. When the Sam Rules Recession Index (3-month moving average of the unemployment rate - previous year's low) exceeds 0.5%, it indicates that the economy is experiencing a recession. ③ Custom recession index: Considering that the Federal Reserve's monetary policy goals are to achieve full employment and maintain price stability, the recession situation is assessed through four indicators: GDP month-on-month discount rate, manufacturing PMI, core PCE, and unemployment rate. Combining the above judgment method and the trend of federal funds interest rates, the Federal Reserve initiated 4 bailout interest rate cuts and 5 preventive interest rate cuts after 1982.
Relief interest rate cuts: Common after regional/global crises, interest rate cuts are large and last for a long time. Since 1982, the Federal Reserve has carried out a total of 4 bailout interest rate cuts, each in response to a major regional/global crisis. Since these crisis events are often sudden and have a wide range and depth of impact, bailout interest rate cuts are larger, more frequent, and last longer (see Table 1 for details). The following will review in detail the macro background of the previous bailout interest rate cuts, the pace and effects of interest rate cuts.
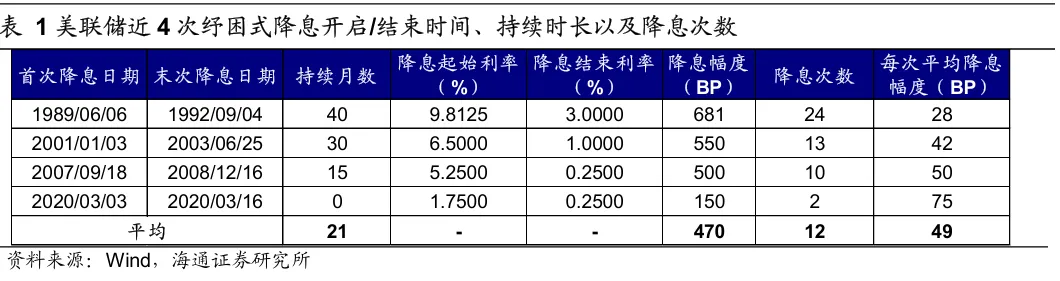
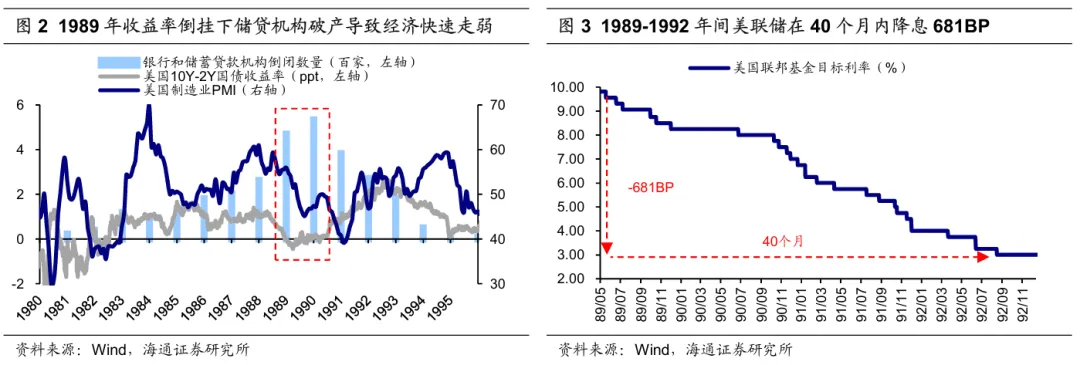
The interest rate cut cycle that began in 1989 was mainly in response to the US economic recession caused by the savings and loan crisis. Interest rates in the US rose rapidly in the late 1980s, causing savings banks to experience a dilemma where interest rates on short-term deposits were higher than interest rates on long-term fixed loans. There was a similar situation in bond yields. The yield on 10Y and 2Y US bonds was inverted at the end of 1989. In this context, the US savings and loan crisis broke out, and many savings and loan institutions went bankrupt. According to statistics from the US Federal Deposit Insurance Company FDIC, an average of 196 banks/savings institutions went out of business every year from 1980 to 1994. Meanwhile, the economy gradually fell into recession, and the US manufacturing PMI fell from 50% in 1990/04 to a low of 39.2% in 1991/01. In order to mitigate the impact of the savings and loan crisis on the economy, the Federal Reserve began cutting interest rates on 1989/06, and cut interest rates 24 times over the next 40 months, with a cumulative decline of 681 BP. Judging from the effects of interest rate cuts, economic indicators soon picked up, and the manufacturing PMI trend rebounded from 1991 to 1994.
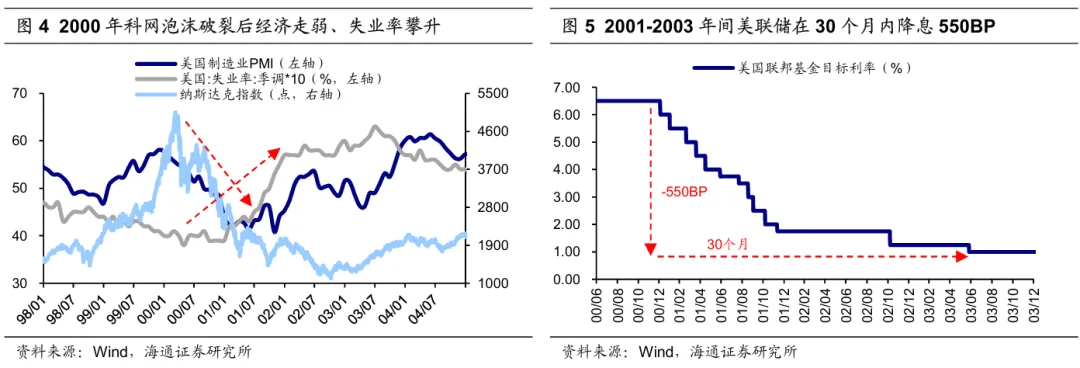
Interest rate cuts began in 2001 to cope with the overall recession of the US economy caused by the bursting of the TechNet bubble. In 2000, the US capital market was impacted by the bursting of the Internet bubble. A large number of Internet companies went bankrupt and went out of business, and the economy fell into recession. Our customized recession index shows that US economic data began to deteriorate at the end of 1999, and the three key indicators of GDP, PMI, and unemployment rate all showed significant declines. In order to overcome the impact of the bursting of the bubble, promote economic recovery, and promote the development of emerging industries, and to ease the panic caused by the “911” terrorist attacks in 2001, the Federal Reserve announced a reduction in the federal funds target interest rate on 2001/1/3. After 30 months and 13 interest rate cuts, the cumulative drop was 550 BP. The policy interest rate eventually fell to about 1%, far lower than the interest rate level during the previous policy easing period. Under this environment, the US economy returned to a growth trajectory in 2002, the PMI took the lead in recovering, and the unemployment rate gradually improved from the second half of 2003.
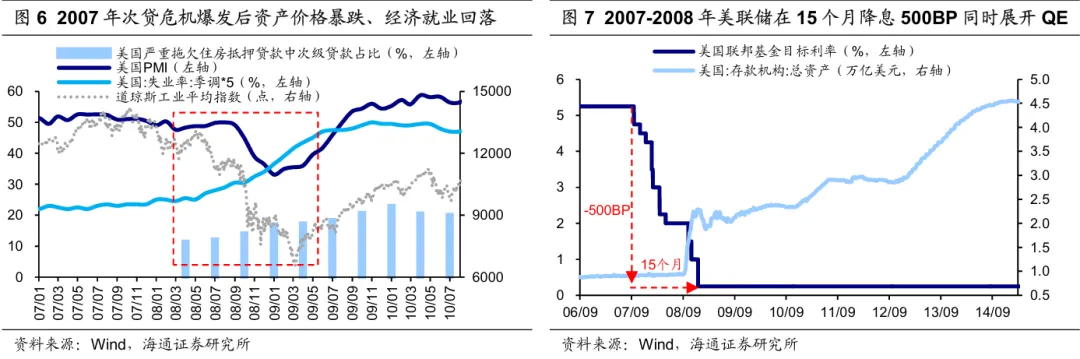
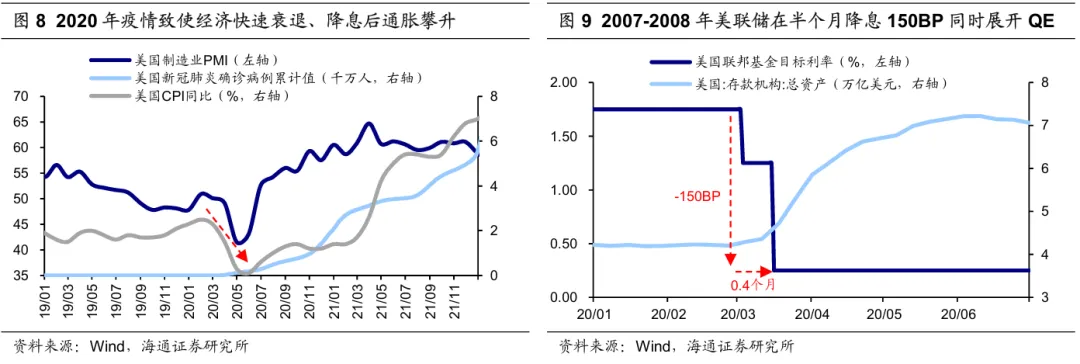
Interest rates have been cut since 2007 to help the US economy recover from the haze of recession after the financial crisis. Since 2007, the US subprime mortgage crisis has gradually emerged, and the share of subprime mortgage defaults has continued to rise. The crisis then spread further to other markets such as debt stocks. For example, the biggest decline in the Dow during 2007/09-2009/06 was 53.8%. Meanwhile, due to a sharp turn in the US economic situation, the unemployment rate once rose to 10%, and the manufacturing PMI from 2008 to 2009 was mostly below the 50% boom and dry line. In this context, the Federal Reserve cut interest rates urgently in 2007/09, and cut interest rates 10 times in a row since then. By the end of 2008, interest rates had dropped by 550 BP to an ultra-low level of 0.25%. However, interest rate cuts are still insufficient to cope with the severe economic situation. For the first time, the Federal Reserve introduced quantitative easing QE to reduce long-term interest rates, stimulate the economy, and inject liquidity into the market through large-scale purchases of US Treasury bonds and mortgage-backed securities. Under the combined effects of interest rate cuts and QE, the US economy came out of recession, and the manufacturing PMI and GDP year-on-year showed that the economic situation began to pick up in the second half of 2009.
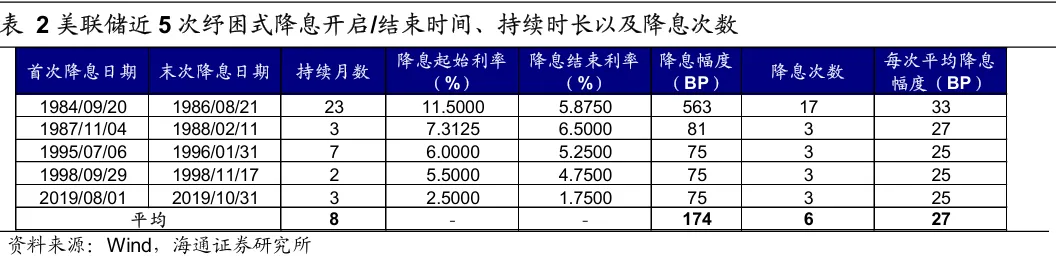
Interest rate cuts in 2020 focused on dealing with the severe impact of the COVID-19 outbreak on the US economy. With the outbreak of COVID-19 in early 2020, the global economy was greatly impacted, and countries introduced epidemic prevention and control measures one after another. Among them, there was no shortage of restrictive measures that had a negative impact on production and consumption. Under these circumstances, the US economy was hit hard in a short period of time, and the manufacturing PMI fell from 50.9% in 2020/01 to 41.5% in 2020/04. To this end, the Federal Reserve quickly made a decision to cut interest rates, and on March 3 and 16, 2020, two consecutive operations were lowered by 150BP, and interest rates fell to the lowest level of 0.25% at once. In addition, the Federal Reserve has also restarted quantitative easing and launched a series of emergency loan programs to support the market and mitigate the huge impact of the pandemic on the economy. Stimulated by the large-scale easing policy mentioned above, the US economy achieved a V-shaped recovery. At the same time, the level of inflation also rose rapidly. Since 2020/06, the CPI has continued to rise year on year.
2. Preventive Interest Rate Cuts: Policy Preparation in the Face of Adverse Factors
The previous article mainly reviewed the macro background, pace, and effects of the Federal Reserve's bailout interest rate cut cycles. Unlike bailout interest rate cuts, the purpose of preventive interest rate cuts is to prevent the risk of an economic recession that has not yet occurred, that is, the economy has not yet entered recession. Preventive interest rate cuts usually occur in the context of what era, and what is the extent and frequency of interest rate cuts? The analysis is carried out below.
Preventive interest rate cuts: They mostly occur when economic indicators show a slowing trend. Interest rate cuts are small and the duration is short. Since 1982, the Federal Reserve has carried out a total of 5 bailout interest rate cuts. Normally, the growth rate of certain economic indicators is slowing down or declining at this time. The Fed cut interest rates to prevent risks. The specific reasons that triggered preventive interest rate cuts are quite diverse. Judging from the pace of interest rate cuts, compared to bailout interest rate cuts, preventive interest rate cuts are small, the duration is short, and the number of interest rate cuts is small (see Table 2 for details). The following will review in detail the macro background of previous preventive interest rate cuts, the pace and effects of interest rate cuts.
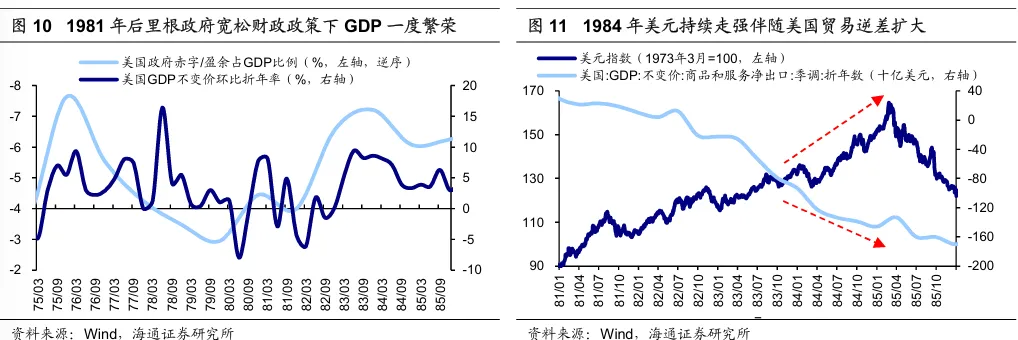
The purpose of the 1984 interest rate cut was to prevent high deficits and strong dollar from causing exchange rate fluctuations, thereby impacting the economy. Since the Reagan administration came to power in 1981, it continued to implement a loose fiscal policy, which promoted the prosperity of the US economy. However, the fiscal deficit continued to expand. As of 1984, the US government deficit had reached 6.1% of GDP, which is at a high level in history. Meanwhile, against the backdrop of the strengthening of the US dollar, the trade deficit continued to increase, and net exports of US goods and services exceeded 100 billion US dollars for the first time in 1984Q1. The Federal Reserve believes that the development model of loose finance and high deficits at the time was unsustainable and that the US dollar was too strong. In order to prevent the risk of future fluctuations in the domestic economy due to a possible decline in the exchange rate, the Federal Reserve began the interest rate cut cycle in September 1984. Over the next 23 months, the total rate cut reached about 560 BP. Judging from the effects of interest rate cuts, the overstrong US dollar was suppressed after the current interest rate cut, the trend of trade deficit widening gradually slowed down, and the overall economic growth situation was steady.
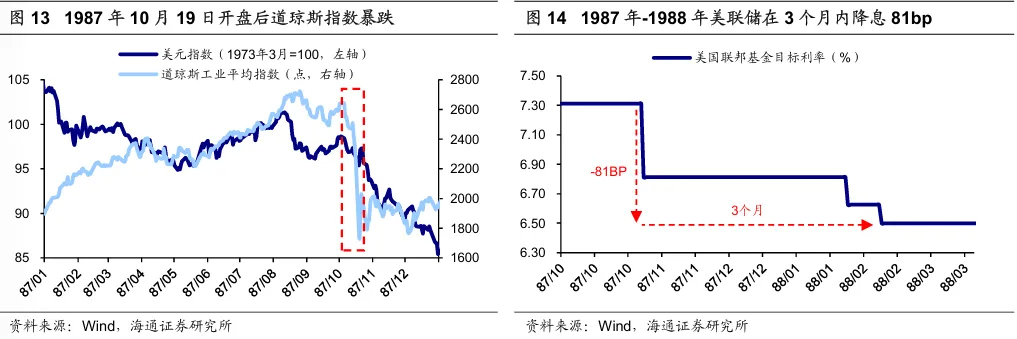
Interest rate cuts began in 1987 mainly to prevent “Black Monday” pessimism from spilling over into the real economy. The fundamentals of the US economy stabilized in 1987. Judging from GDP and PMI indicators, the US GDP depreciation rate reached 3.4% month-on-month during the 1986/09-1987/09 period, and the US manufacturing PMI also basically remained above the boom/bust line. Although there were no problems with the economy, news such as the excessive rise in stock prices in the early period, the combined trade deficit exceeding expectations, and the fall in the US dollar intensified investors' pessimism about future economic expectations, which eventually led to a sharp drop in US stocks in mid-October. In particular, on October 19, 1987, known as “Black Monday,” the Dow fell by more than 20% on that day alone. In order to prevent the stock market decline from spilling over to the real economy, the Federal Reserve decided to release liquidity to the market through treasury bonds, cut interest rates for the first time in November 1987, and cut interest rates 3 times in a row over the next 3 months, with a cumulative decline of 81 BP. Judging from the effects of interest rate cuts, the Dow Jones index gradually rebounded steadily thereafter, and the US real economy did not show significant fluctuations.
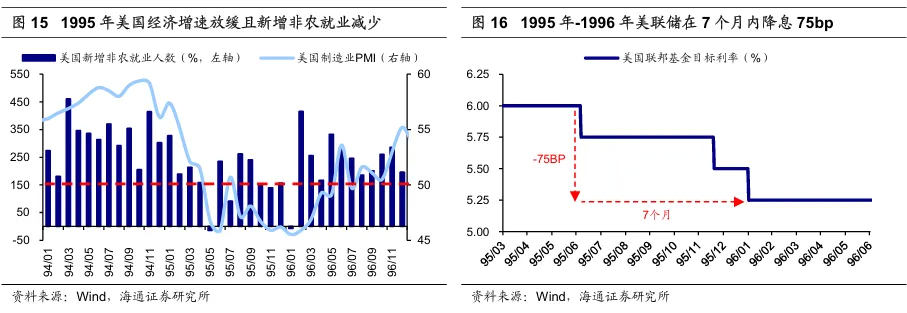
Interest rates were cut in 1995 to prepare for a “soft landing” of the economy in response to weak economic growth. The growth rate of the US economy showed signs of slowing down in 1995. A Federal Reserve spokesperson mentioned: “Currently, consumer consumption is still weak, and the growth rate of fixed asset investment by manufacturers has clearly slowed in the past few quarters. As terminal sales decline, manufacturers control inventory by curbing production and employment”. In particular, judging from the two indicators of the unemployment rate and PMI, the number of new non-farm payrolls in the US continued to be sluggish. The cumulative increase in January-July was only 1.201 million, a year-on-year decrease of 47.4%; the manufacturing PMI continued to decline since the beginning of 1995 and fell to 45.9% in June, which is below the boom-bust line. The Federal Reserve believes that although the economy is not in recession, the decline in some economic indicators may suggest the risk of future economic downturn, so it decided to start cutting interest rates to stimulate the economy and prevent recession. The interest rate cut began in 1995/07, and after 7 months, the decline reached 75BP. With monetary policy support, the US economy achieved a “soft landing,” and weak employment and manufacturing PMI indicators rebounded before interest rate cuts.
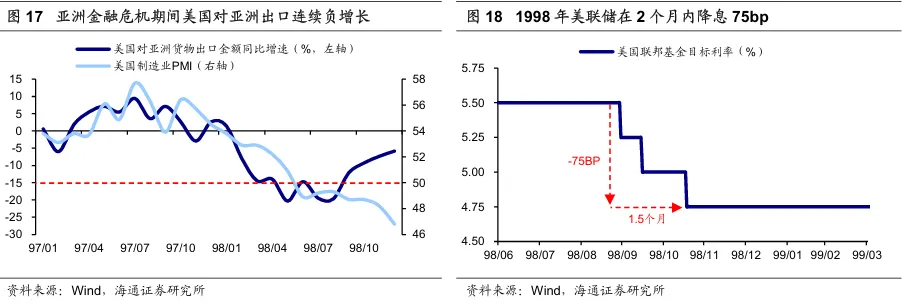
Interest rate cuts in 1998 were mainly aimed at preventing the risk of recession that could be caused by the spread of the Asian financial crisis. The Asian financial crisis broke out in 1997, and the Asian economic recession led to a weakening in external demand, which directly affected US commodity trade. Although the overall US economy has remained stable, since 1998/02, the value of US exports of goods to Asia has continued to grow negatively year on year, and the year-on-year decline widened to 19.7% in 1998/08. Furthermore, weak commodity trade has also put pressure on US manufacturing companies, and the manufacturing PMI has continued to fall below the boom and bust level since 1998/06. Furthermore, the Asian financial crisis has also triggered risk exposure for a range of financial institutions, such as the bankruptcy of long-term capital management companies (LTCM), and the liquidation of their positions poses a risk of causing further financial chaos. In order to prevent the impact of the crisis from further affecting the US economy, the Federal Reserve began cutting interest rates in 1998/09, and cut interest rates 3 times in a row within the next 2 months, with a cumulative decline of 75BP. Through timely intervention by the Federal Reserve, the US economic indicators were generally stable, and the manufacturing PMI, which had declined earlier, returned above the boom and bust line in early 1999.
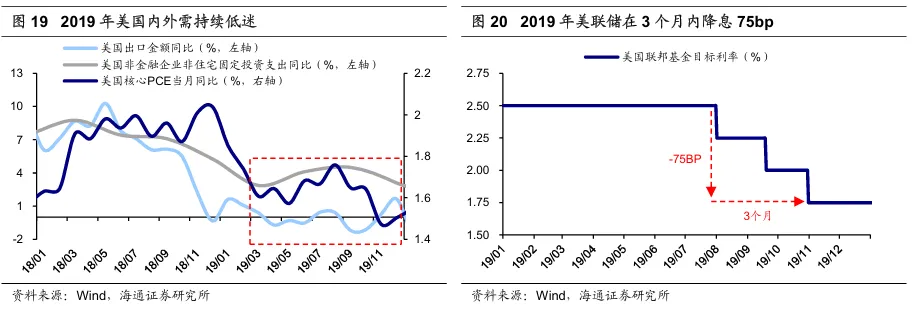
Interest rate cuts in 2019 are to prevent the risk of economic recession that may be caused by weakening domestic and foreign demand. The overall US economy maintained steady growth in 2019, but due to factors such as geopolitical conflicts, US external demand weakened somewhat. From January to August before interest rate cuts in 2019, the cumulative export value of the US was about 0.17 billion US dollars, an increase of only 0.3% over the previous year. At the same time, domestic demand is also slowing down. In 2019/08, the US core PCE increased by about 1.8% year on year, below the Federal Reserve's 2% target, reflecting the weakening of domestic demand in the US. Furthermore, due to trade frictions between China and the US and the simultaneous contraction of domestic and foreign demand, the US domestic manufacturing industry showed signs of contraction. In 2019, corporate fixed asset investment grew slowly, and the manufacturing PMI fell. To prevent the economy from falling into recession, the Federal Reserve began cutting interest rates in 2019/08. The federal funds target interest rate was reduced from 2.5% to 1.75% within the next 3 months, with a total interest rate cut of 75BP. Until the outbreak of the global epidemic in 2020, the overall US economy operated steadily, and indicators such as manufacturing PMI and core PCE rebounded.
3. Asset performance: Equities have a higher win rate during the preventive interest rate cut period
Above, we have reviewed in detail the macro background, pace, and effects of the Fed's successive interest rate cuts since 1982. Further, what impact did successive Fed interest rate cuts have on global asset price trends? The following will discuss the performance of equity, fixed income, foreign exchange, and commodity asset prices during the interest rate cut cycle one by one, with a view to providing reference for investors.
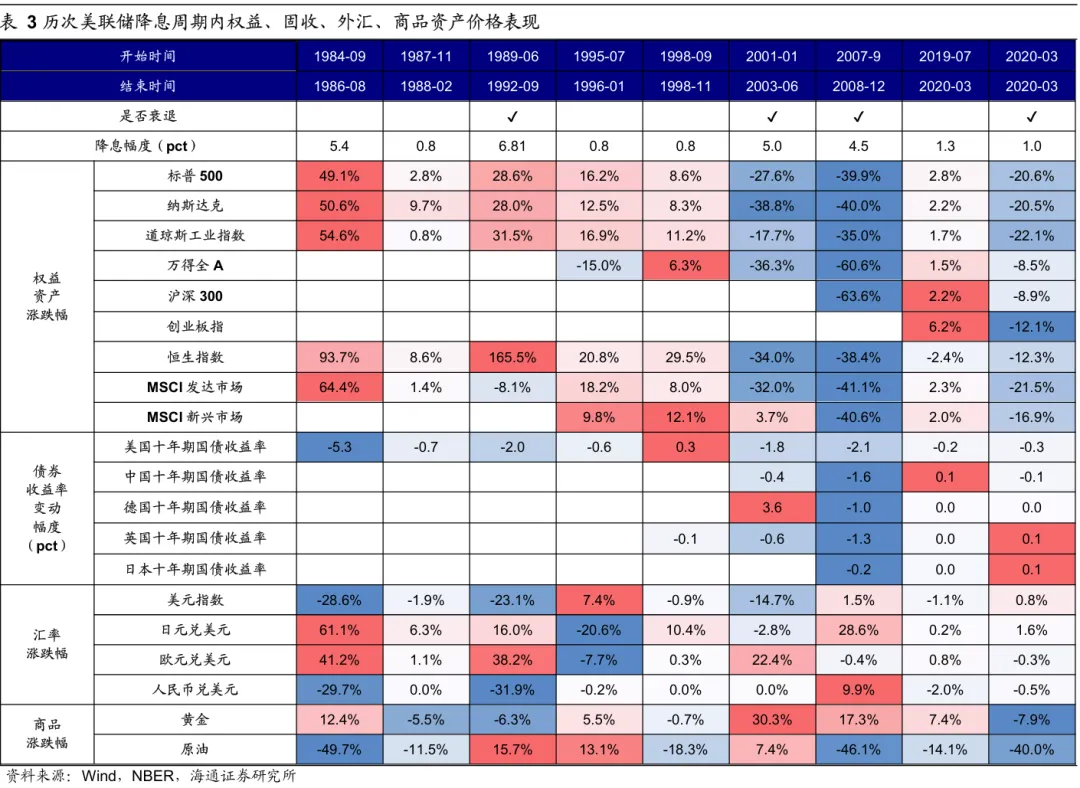
The Fed's interest rate cut will have a significant impact on the trend of equity, fixed income, and foreign exchange assets, but the pattern of rising and falling commodity prices is not obvious. Observing the performance of the prices of various major asset classes during the nine full interest rate cut cycles, it can be found that:
① Equity assets have a higher win rate during the preventative interest rate cut period, and the probability of falling during the bailout interest rate cut period. With the exception of the 1989-1992 interest rate cut cycle, most equity assets rose during the preventive interest rate cut period and basically fell during the bailout interest rate cut period. Specifically, in terms of US stocks, the Dow reacted most violently to interest rate cuts, followed by S&P 500 and NASDAQ; in the domestic stock market, the trend of A shares and Hong Kong stocks was basically the same as that of US stocks during the interest rate cut, but the trend of A-shares was somewhat independent; developed markets performed better than emerging markets, but during the period of preventive interest rate cuts, emerging markets are likely to be more flexible.
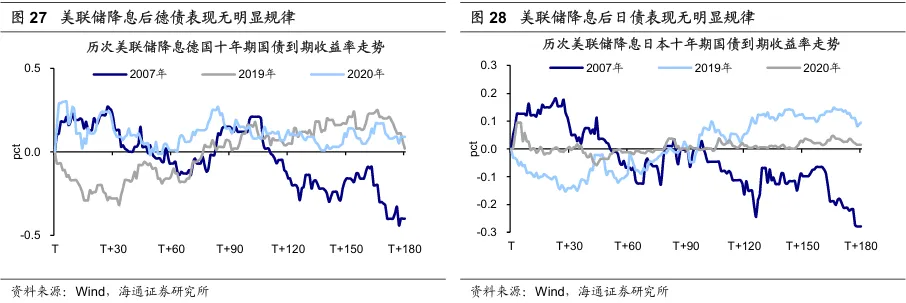
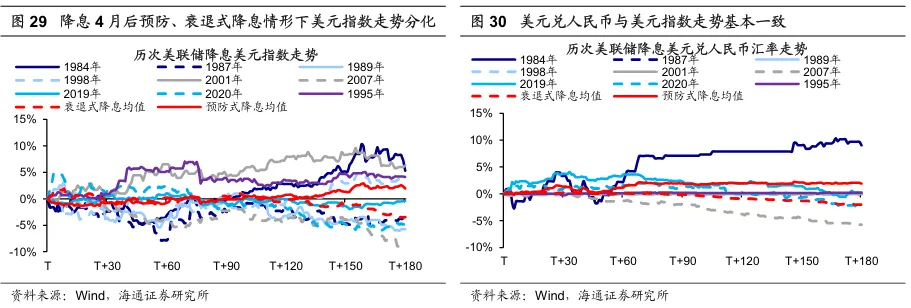
② Regardless of preventative/bailout interest rate cuts, bond interest rates are likely to fall and prices to rise. Whether it is a preventative interest rate cut or a bailout interest rate cut, there is a high probability that interest rates on US bonds will decline; interest rates on Chinese bonds have also basically declined, but the decline is slightly less than that of US debt. It is important to note that since there are few samples of Chinese treasury bonds that have experienced the Fed's interest rate cut cycle, there may be some uncertainty about this conclusion; the correlation between interest rates on German bonds, British bonds, and Japanese bonds and interest rate cuts by the Federal Reserve is not significant.
③ The US dollar is likely to weaken during the interest rate cut, the yen may rise, and the trend of the yuan and the euro is independent. During the entire cycle of the Federal Reserve's interest rate cuts, the US dollar index rose and fell, but the probability of an upward trend was higher than that of a downward trend; the relationship between the RMB exchange rate and the Fed's interest rate cut was not significant, and the trend is somewhat independent; the yen exchange rate is likely to rise, but there have also been cases of depreciation in history; the euro exchange rate has fluctuated, and is relatively less affected by the Federal Reserve's monetary policy.
④ The relationship between commodity prices and interest rate cuts is weak, and the average increase of gold during the bailout interest rate cut period was higher. Historically, during the full cycle of the Fed's interest rate cut, gold rose and fell, but the average rise and fall rate of gold rose during the nine interest rate cut cycles, and the increase during the bailout interest rate cut period was higher than the preventive interest rate cut (it is important to note that the large increase in 2001/01/2003/06 gold may interfere with the conclusion); crude oil prices also rose and fall, but the average rise and fall rate of the nine interest rate cut cycles dropped markedly.
The equity win rate increased after 1 month of preventive interest rate cuts. After the interest rate cut, interest rates on US bonds declined, and interest rates on Chinese bonds also declined in the short term. Further, when reviewing the price trends of various major asset classes within 30 days, 60 days, 90 days, 120 days, 150 days, and 180 days after the first rate cut in the nine interest rate cut cycles, it can be found:
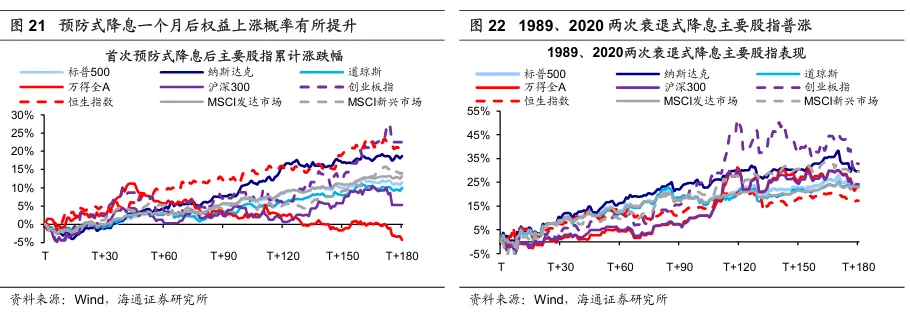
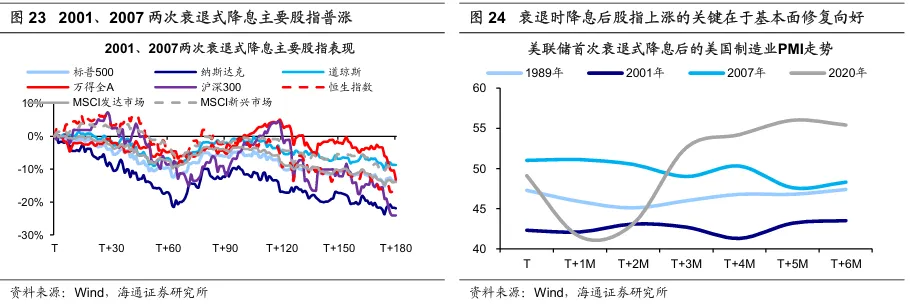
Equity: The win rate increased after 1 month of preventive interest rate cuts. The performance of recessionary interest rate cuts is related to fundamental restoration. Looking at the different types of interest rate cuts, if the Federal Reserve adopts preventive interest rate cuts, combined with the above analysis, the economy often slows down marginally or changes in trend at this time. The data shows that within 1 month of the Federal Reserve's first preventive interest rate cut, equity assets usually do not increase much, but the probability of an increase after 1 month usually increases. This is probably because preventive interest rate cuts often have a quick positive effect and reverse signs of economic weakening, thereby driving up the stock market. It is worth noting that Wandequan A and Shanghai and Shenzhen 300 had a higher winning rate within 1 month of implementing the first preventive interest rate cut. Regarding recessionary interest rate cuts, we found that stock indexes generally rose during the recessionary interest rate cut cycle in 1989 and 2020, while stock indexes generally fell in 2001 and 2007. Perhaps the key behind this is whether interest rate cuts can quickly repair fundamentals. Specifically, the US manufacturing PMI showed signs of recovery after recessionary interest rate cuts in 1989 and 2020, while the two PMI recoveries in 2001 and 2007 were weak.
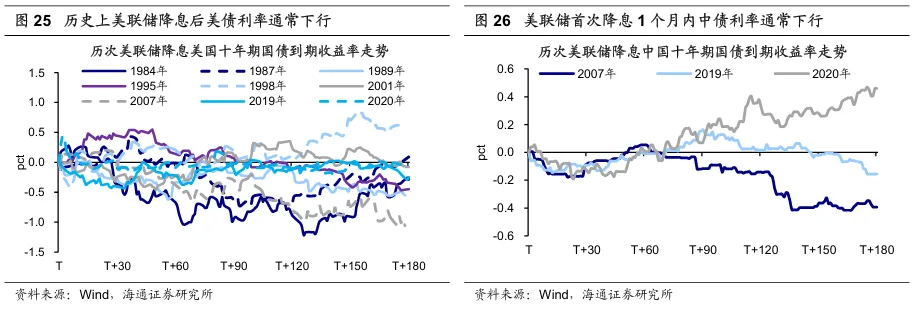
Bonds: After interest rate cuts, interest rates on US bonds usually decline, interest rates on Chinese bonds fall in the short term, and there is no clear pattern on German bonds and Japanese bonds. According to data from previous interest rate cuts, the yield to maturity of US 10-year Treasury bonds declined within 30, 60, and 180 days after the first rate cut, with an average decline of 0.2%, 0.3%, and 0.3%, respectively. It should be noted that in the early stages of interest rate cuts, interest rate trends on bonds were mainly affected by interest rate cuts, and there was a decline; however, in the later stages of interest rate cuts, interest rate trends easily diverged due to differences in economic recovery. On the Chinese debt side, judging from the data for the three interest rate cut cycles in 2007, 2019, and 2020, there is a high probability that interest rates on Chinese bonds will fall within 1 month of the Federal Reserve's interest rate cut, but uncertainty about the trend increased thereafter. Judging from historical data, there is no significant correlation between these treasury bond yields and the interest rate trend after interest rate cuts. It can be seen that their pricing is more affected by internal factors such as the country's economic policy/situation.
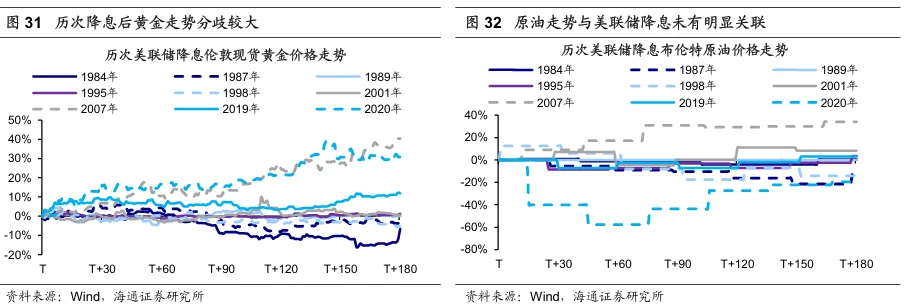
Foreign exchange: The US dollar is likely to weaken after interest rate cuts, especially 4 months after the first recessionary interest rate cut was implemented. Reviewing the previous cycle of the Fed's interest rate cuts, it is difficult to predict the direction of the US dollar index within 4 months of the first interest rate cut; however, after 4 months, the trend of the US dollar index under recessionary interest rate cuts and preventive interest rate cuts began to diverge clearly. Among the 4 recessionary interest rate cuts, the US dollar index weakened 3 times, and the US dollar index strengthened 3 times during the 5 preventive interest rate cuts. Furthermore, judging from the rise and fall of the US dollar index within 6 months of interest rate cuts, the US dollar index fell by an average of 3.5% during the recessionary interest rate cut cycle, while the US dollar index rose by an average of 2.0% during the preventive interest rate cut cycle. Furthermore, the trend pattern of the US dollar against the renminbi is similar to the US dollar index. After the interest rate cut is implemented, based on the average rise and fall rate, the preventative interest rate cut depreciates the RMB relatively, while the recessionary rate cut appreciates the RMB relatively.
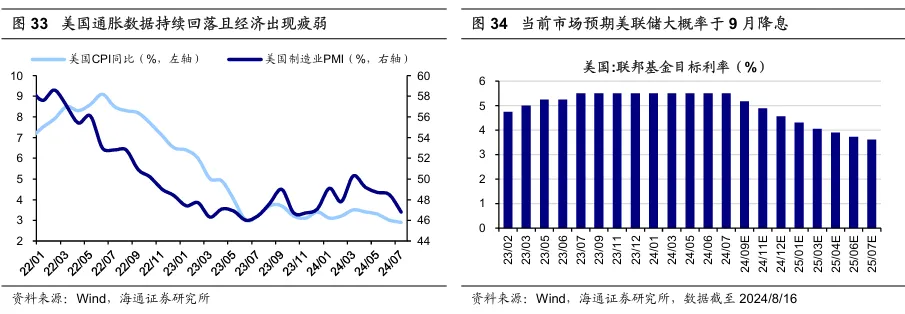
Commodities: After bailout interest rate cuts, gold's upward elasticity is greater, and the trend of crude oil has little to do with interest rate cuts. On the gold side, the two bailout interest rate cuts in 2007 and 2020 are quite special. Gold increased by more than 20% within 3 months of the first interest rate cut, and rose significantly again after 3 months of interest rate cuts. The likely reason for these two increases is the persistence of instability factors after major crisis events, increasing the allocation value of gold as a safe-haven asset. Overall, during the bailout interest rate cuts, the rise in gold prices was relatively more flexible. In contrast, crude oil prices did not show obvious patterns during the recessionary or preventive interest rate cut cycle. It can be seen that crude oil prices were more affected by factors such as supply and demand at the time.
On the other hand, at present, the Federal Reserve is likely to enter a cycle of interest rate cuts, compounded by improvements in domestic fundamentals, and the market center is expected to rise. Recently, US inflation has continued to ease, and economic data are showing signs of weakening. The market expects the Federal Reserve to start cutting interest rates in September. In terms of inflation, the US CPI was 2.9% year on year in July, down 0.1 percentage points from June, and has been easing for four consecutive months; in terms of economic data, the US manufacturing PMI in July was 46.8%, which has been declining for four consecutive months. Furthermore, on July 31, Federal Reserve Chairman Powell stated at the FOMC meeting press conference that “if we get the data we expect, there is a possibility that we will discuss lowering policy interest rates at the September meeting.” In this context, the Federal Reserve may begin the interest rate cut cycle in the second half of the year. According to Fed Watch data, as of 24/08/16, the market expects the Fed to cut interest rates in September, 3 times during the year. Looking back, the Fed's interest rate cut will help long-term capital flow back into the A-share market.
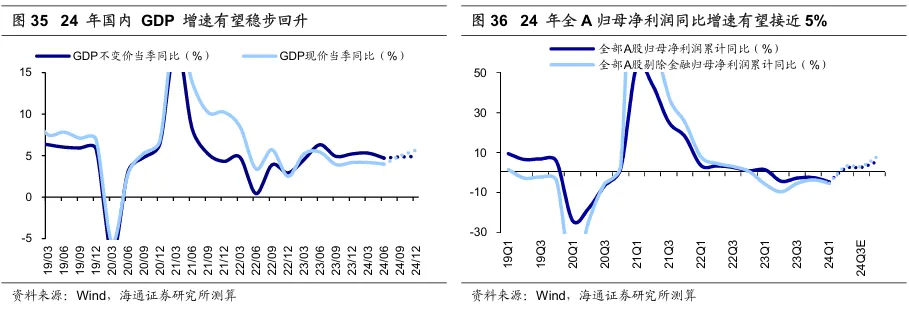
Looking at fundamentals, the conference set a positive tone, and domestic macro-micro fundamentals are expected to improve under strong policies. The July 3rd Plenary Session of the Central Committee and the Politburo meeting sent a signal of steady growth. The Politburo meeting proposed “macroeconomic policies should continue to be vigorous and more powerful” and “countercyclical adjustment should be strengthened”. With the gradual introduction and implementation of subsequent steady growth policies, China's macro-micro fundamentals are expected to gradually stabilize. Combined with Haitong's macroeconomic forecasts, the real domestic GDP growth rate is expected to reach 5% year-on-year in 24, implemented at the level of micro enterprise profits. Catalyzed by positive financial and fundamental factors, the A-share market center in the second half of the year may be expected to rise compared to the first half of the year.
At the industry level, advantage manufacturing may become the main line of the stock market in the medium term. The Third Plenary Session of the 20th Central Committee stated that “it is necessary to improve the institutional mechanism for developing new quality productivity according to local conditions, and improve the system to promote the deep integration of the real economy and the digital economy,” which clearly guides the path for China's industrial reform and development in the future. Looking at the medium term, around a high level of technological self-reliance and self-improvement, China's superior manufacturing is expected to become an important sector leading the development of new quality productivity. High-end manufacturing with competitive export advantages and technological manufacturing leading the development of new quality productivity are worth paying attention to.
Risk warning: The implementation of the steady growth policy fell short of expectations, and domestic economic recovery fell short of expectations.
This article is reprinted from the WeChat account “Haitong Research”; Authors: Wu Xinkun, Wang Zhenghe, Chen Fei.
edit/ping