
The Yoma Strategic Holdings Ltd. (SGX:Z59) share price has softened a substantial 26% over the previous 30 days, handing back much of the gains the stock has made lately. Looking back over the past twelve months the stock has been a solid performer regardless, with a gain of 11%.
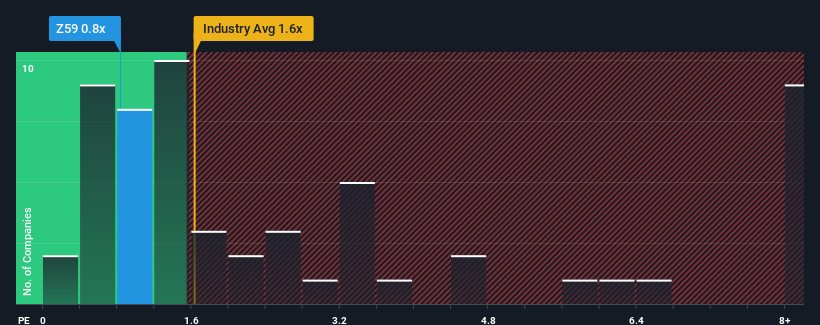
In spite of the heavy fall in price, Yoma Strategic Holdings may still be sending buy signals at present with its price-to-sales (or "P/S") ratio of 0.8x, considering almost half of all companies in the Real Estate industry in Singapore have P/S ratios greater than 1.6x and even P/S higher than 4x aren't out of the ordinary. However, the P/S might be low for a reason and it requires further investigation to determine if it's justified.
What Does Yoma Strategic Holdings' Recent Performance Look Like?
Yoma Strategic Holdings certainly has been doing a great job lately as it's been growing its revenue at a really rapid pace. Perhaps the market is expecting future revenue performance to dwindle, which has kept the P/S suppressed. If you like the company, you'd be hoping this isn't the case so that you could potentially pick up some stock while it's out of favour.
Want the full picture on earnings, revenue and cash flow for the company? Then our free report on Yoma Strategic Holdings will help you shine a light on its historical performance.How Is Yoma Strategic Holdings' Revenue Growth Trending?
 The only time you'd be truly comfortable seeing a P/S as low as Yoma Strategic Holdings' is when the company's growth is on track to lag the industry.
If we review the last year of revenue growth, the company posted a terrific increase of 107%. The strong recent performance means it was also able to grow revenue by 151% in total over the last three years. Therefore, it's fair to say the revenue growth recently has been superb for the company.
Weighing the recent medium-term upward revenue trajectory against the broader industry's one-year forecast for contraction of 2.5% shows it's a great look while it lasts.
With this information, we find it very odd that Yoma Strategic Holdings is trading at a P/S lower than the industry. Apparently some shareholders believe the recent performance has exceeded its limits and have been accepting significantly lower selling prices.
What Does Yoma Strategic Holdings' P/S Mean For Investors?
Yoma Strategic Holdings' recently weak share price has pulled its P/S back below other Real Estate companies. Generally, our preference is to limit the use of the price-to-sales ratio to establishing what the market thinks about the overall health of a company.
Our examination of Yoma Strategic Holdings revealed that despite growing revenue over the medium-term in a shrinking industry, the P/S doesn't reflect this as it's lower than the industry average. We think potential risks might be placing significant pressure on the P/S ratio and share price. Amidst challenging industry conditions, perhaps a key concern is whether the company can sustain its superior revenue growth trajectory. It appears many are indeed anticipating revenue instability, because this relative performance should normally provide a boost to the share price.
Having said that, be aware Yoma Strategic Holdings is showing 3 warning signs in our investment analysis, and 1 of those doesn't sit too well with us.
Of course, profitable companies with a history of great earnings growth are generally safer bets. So you may wish to see this free collection of other companies that have reasonable P/E ratios and have grown earnings strongly.
Have feedback on this article? Concerned about the content? Get in touch with us directly. Alternatively, email editorial-team (at) simplywallst.com.
This article by Simply Wall St is general in nature. We provide commentary based on historical data and analyst forecasts only using an unbiased methodology and our articles are not intended to be financial advice. It does not constitute a recommendation to buy or sell any stock, and does not take account of your objectives, or your financial situation. We aim to bring you long-term focused analysis driven by fundamental data. Note that our analysis may not factor in the latest price-sensitive company announcements or qualitative material. Simply Wall St has no position in any stocks mentioned.
