
The precious metal key indicator "Gold To Silver Ratio" (Gold To Silver Ratio) shows that it seems to be replaying the peaks of the 1980s, early 1990s, and 2020 periods. The ratio will increase because gold is seen as a more stable store of value. FXEmpire analyst Muhammad Umair stated that the target price of $3000 for gold and $50 for silver is expected to be achieved.
The gold-silver ratio is an important indicator in the precious metal industry, which provides valuable insights into the relative value between gold and silver. The ratio is calculated by dividing the gold price by the silver price. The ratio has shown cyclical behavior in history, reflecting potential economic conditions.
During economic difficulties or deflationary periods, the ratio will increase because gold is seen as a more stable store of value and is therefore more popular. Conversely, during economic expansions, when industrial demand for silver increases, the ratio typically decreases. Investors, traders, and economists closely monitor this ratio to gauge market sentiment and discover potential investment opportunities.
During market crises and recessions, the performance of the gold-silver ratio further highlights its importance. The ratio usually rises during periods of market turmoil and instability, reaching its peak during recessions. This article outlines the fundamentals of the gold and silver markets and their correlation with the gold-to-silver ratio. Observations suggest that the peak of this ratio indicates that the gold and silver markets have bottomed out, providing valuable investment opportunities.
The following chart shows the gold-silver ratio for the past 60 years:
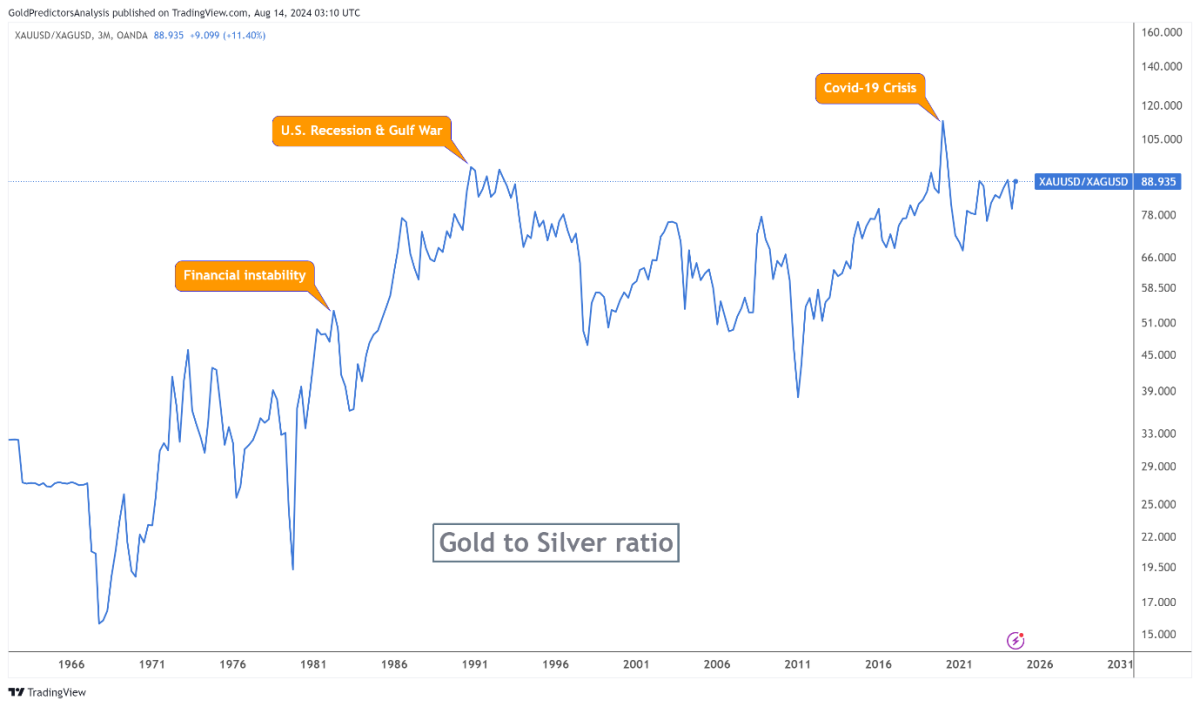
(Source: FXEmpire)
The ratio fluctuates between 15 and 112 and shows an increasing trend over time. Significant peaks occurred in 1982, the early 1990s, and 2020.
The peak in 1982 was mainly driven by economic and geopolitical factors, which led investors to view gold as a safer asset. During this period, the world was struggling with the lingering effects of high inflation, economic uncertainty, and the 1979 energy crisis. As a result, demand for gold as a hedge against inflation and economic instability increased significantly. Meanwhile, silver has industrial and investment demand and did not receive the same level of attention, leading to a sharp increase in the ratio.
Similarly, in the early 1980s, the Federal Reserve was actively raising interest rates to combat inflation, further supporting the preference for gold as a store of value over silver. In the early 1990s and 2020s, the gold-to-silver ratio soared again, reflecting similar themes of economic uncertainty and market turbulence. In the early 1990s, the global economy faced pressures from recession, the Gulf War, and the slow recovery from the savings and loan crisis, causing investors to buy gold. Due to the huge industrial demand for silver, silver consumption decreased, leading to an expansion of the ratio.
Similarly, in the early 1990s, the Federal Reserve was actively raising interest rates to combat inflation, further supporting the preference for gold as a store of value over silver. In the early 1990s and 2020s, the gold-to-silver ratio soared again, reflecting similar themes of economic uncertainty and market turbulence. In the early 1990s, the global economy faced pressures from recession, the Gulf War, and the slow recovery from the savings and loan crisis, causing investors to buy gold. Due to the huge industrial demand for silver, silver consumption decreased, leading to an expansion of the ratio.
Similarly, in the early 1990s, the Federal Reserve was actively raising interest rates to combat inflation, further supporting the preference for gold as a store of value over silver. In the early 1990s and 2020s, the gold-to-silver ratio soared again, reflecting similar themes of economic uncertainty and market turbulence. In the early 1990s, the global economy faced pressures from recession, the Gulf War, and the slow recovery from the savings and loan crisis, causing investors to buy gold. Due to the huge industrial demand for silver, silver consumption decreased, leading to an expansion of the ratio.
To better understand the dynamics of the gold-to-silver ratio and its impact on the gold and silver markets, the following monthly chart shows the correlation between the ratio and these markets. Observations suggest that the bull markets in gold and silver in the 21st century are directly related to this ratio. The major peaks of this ratio correspond to the major bottoms of the gold and silver markets.
For example, in 2003, the peak of the gold-to-silver ratio reached 80.65, and gold and silver bottomed out and began to rise strongly. Similarly, during the global financial crisis, the peak of the gold-to-silver ratio reached 80.06, marking the bottom of the gold and silver markets. In 2006, the ratio reached another peak of 83.04. Afterward, gold and silver bottomed out and began another price increase, breaking the previous record.
The bottom of 2020 is different from other years because of the demand for silver in industry. Since the outbreak of the COVID-19 pandemic, industrial demand has declined, causing silver prices to fall below gold, leading to a peak in the gold-to-silver ratio. After this decline, both metals triggered strong price increases.
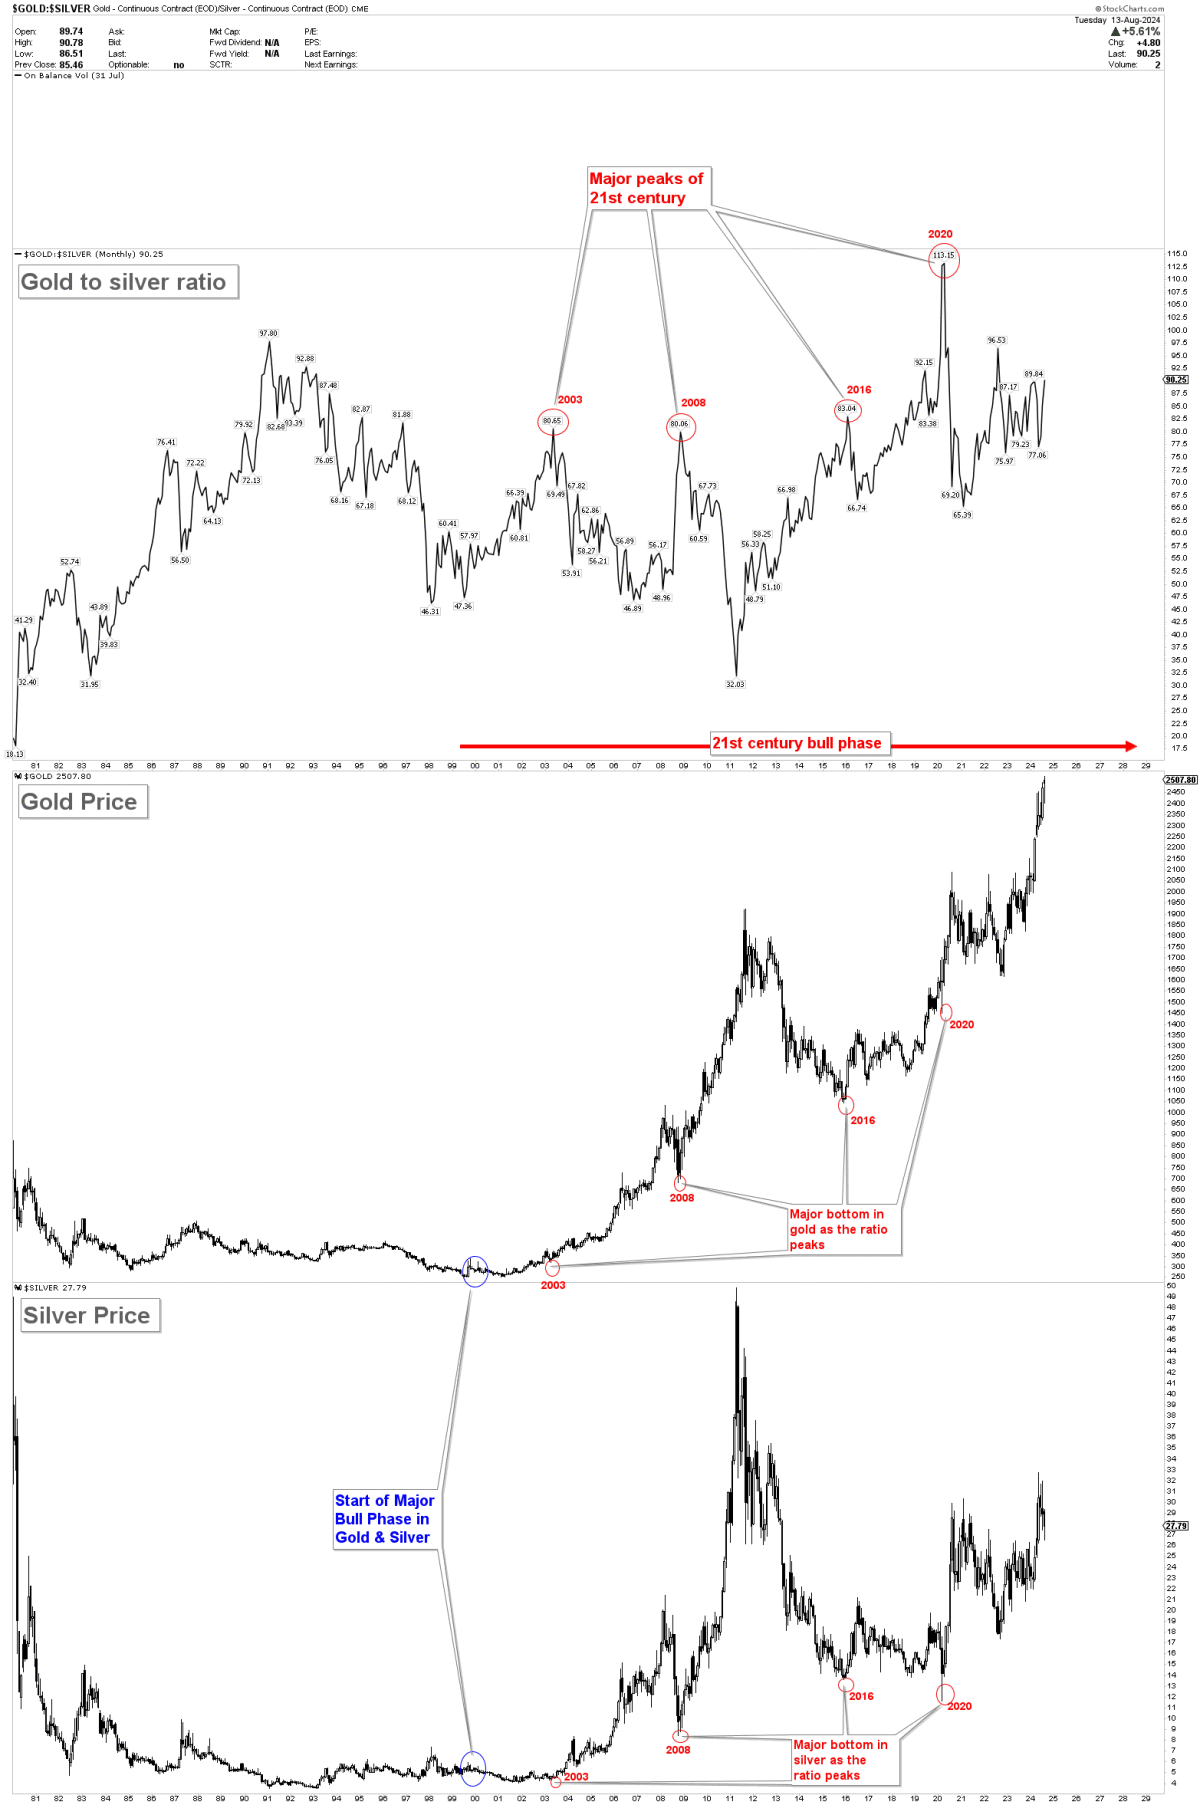
(Source: FXEmpire)
It is interesting that the short-term chart is also closely related to the gold and silver markets in terms of this ratio. The ratio peaked at 90.76 in September 2022, coinciding with the bottoming out of gold and silver. However, research found that the bottoming out of gold in 2022 was delayed after the ratio peaked. This delay is normal when dealing with short-term charts. On the other hand, the bottoming out of silver occurred exactly at the expected time, which is a typical characteristic of silver price behavior. Once bottomed out, the silver price tends to quickly rebound.

(Source: FXEmpire)
Other peaks of this ratio, such as 91.06 in March 2023, also led to strong price increases in both metals. In addition, the peak of 91.76 in February 2024 again resulted in strong price increases in both metals.
Recently, the spot silver market has again bottomed out at a short-term support of $26.80, but the gold market has not yet bottomed out during this bottoming out process. However, the ratio is now touching the resistance line starting from September 2022 and attempting to break through this resistance level.
It seems that this ratio is at a critical level, and breaking through this resistance level will indicate that the adjustment of the two metals has not yet ended, which may result in further price fluctuations. However, if the ratio maintains at this resistance level and begins to correct downward, it indicates that gold and silver have bottomed out and will appreciate. This situation also indicates that the trend of silver will be faster than that of gold, leading to a further decrease in the ratio.
From a technical perspective, the gold and silver markets have recently broken through key resistance levels, indicating strong bullish prospects. Gold has broken through the long-term resistance level of $2075 per ounce and is expected to rise to $3000 per ounce. Similarly, supported by positive technical indicators and a constantly rising gold-silver ratio, silver is expected to rise to $50 per ounce.
This ratio is currently at a critical level. If it encounters resistance here, both metals may catalyze a strong upward momentum. The combination of technical factors and continued supply and demand dynamics suggests that gold and silver prices may continue to rise soon, and may increase significantly as market conditions develop.
Muhammad summed up: "The gold-silver ratio is still an important tool for understanding the dynamics of the precious metals market, especially during times of economic uncertainty and market volatility. Because gold and silver prices continue to be affected by the complex interplay of supply and demand and broader economic factors, the behavior of this ratio provides valuable insights into potential market trends."
"As both metals show strong bullish signals and this ratio is currently at a critical moment, investors should closely monitor these developments as they may herald significant profit opportunities in the near future. In addition, the possibility of a Fed interest rate cut could further push up gold and silver prices, as lower interest rates typically enhance the attraction of these non-yield assets. From a technical standpoint, with a gold target price of $3000 and a silver price close to $50, the rising of this ratio indicates that both metals will experience a significant increase."